Building Energy Boot Camp 2018 - Day 10

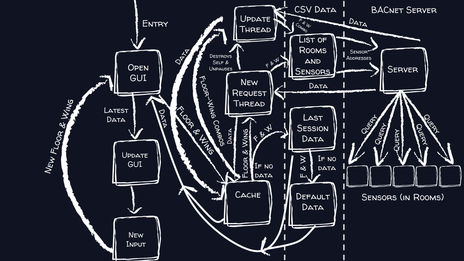
Today, I started creating the presentation for my project, mainly the part which uses a diagram to explain how my program works, which is shown below:
Afterwards, we visited the parts of the high school that most people never see - the boiler room, the emergency generator room, the switchboard room, and even the mysterious dirt room! I took the following photos during our trip (on mobile devices, it is best experienced in horizontal orientation):
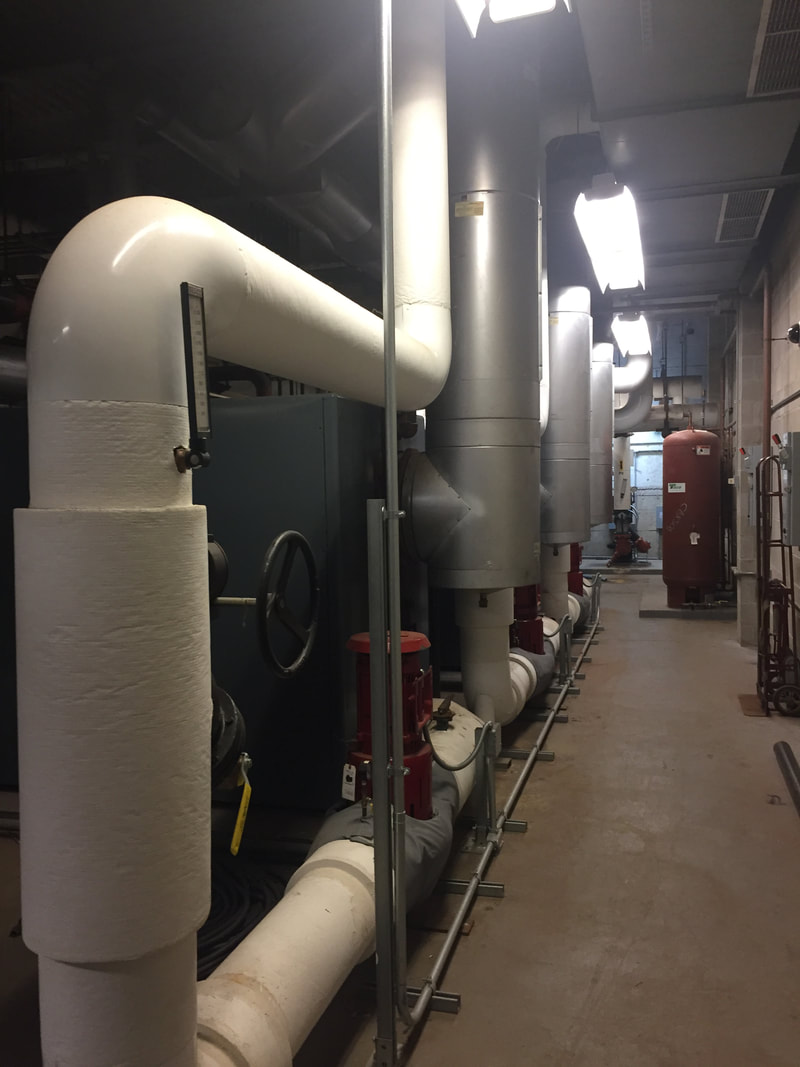
Various pipes in the boiler room
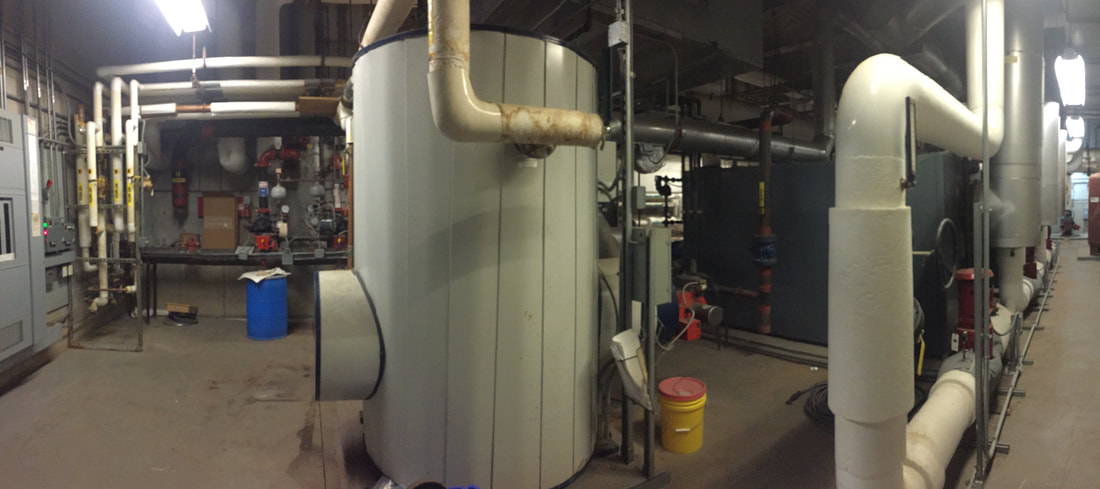
The boiler room
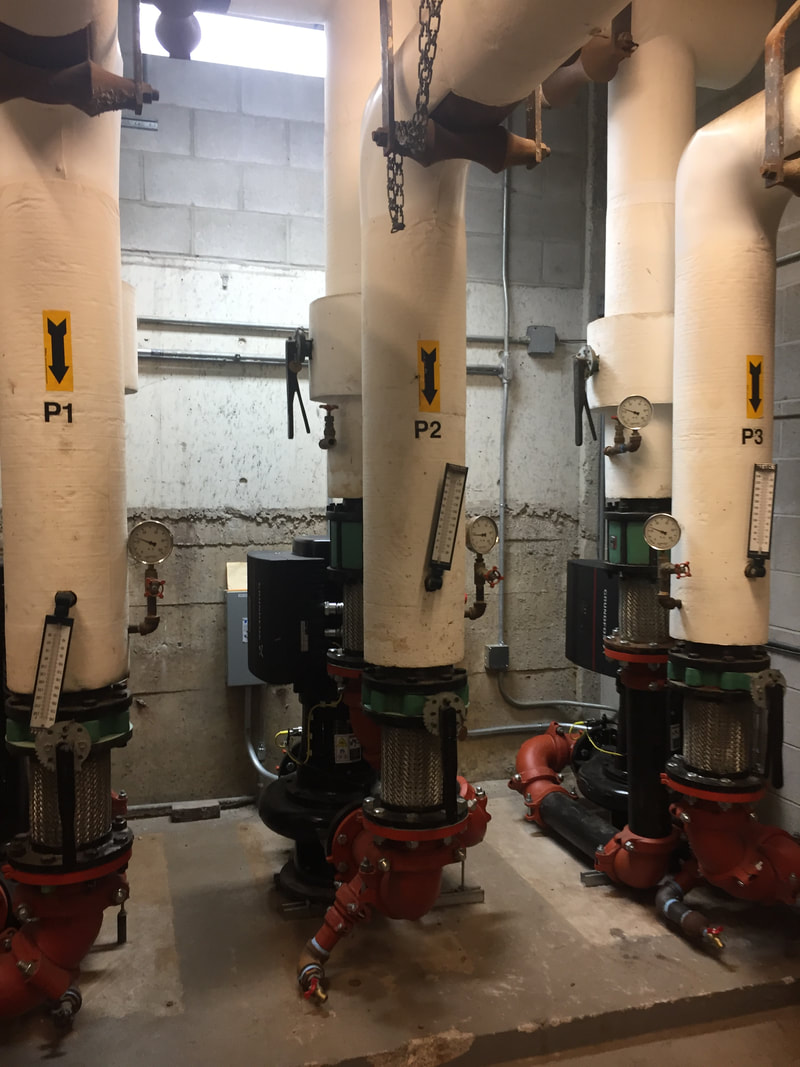
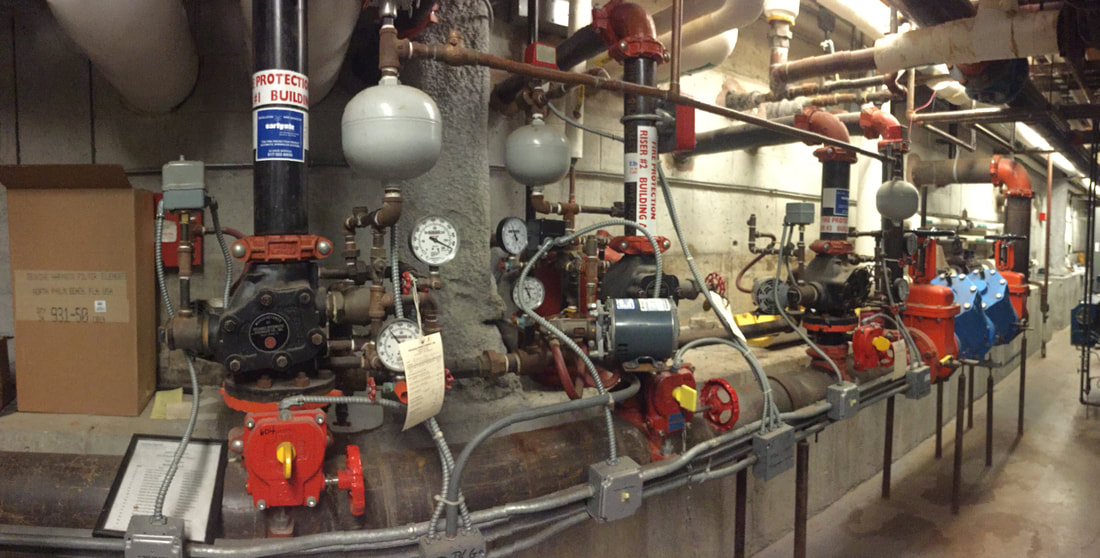
Pumps in the boiler room
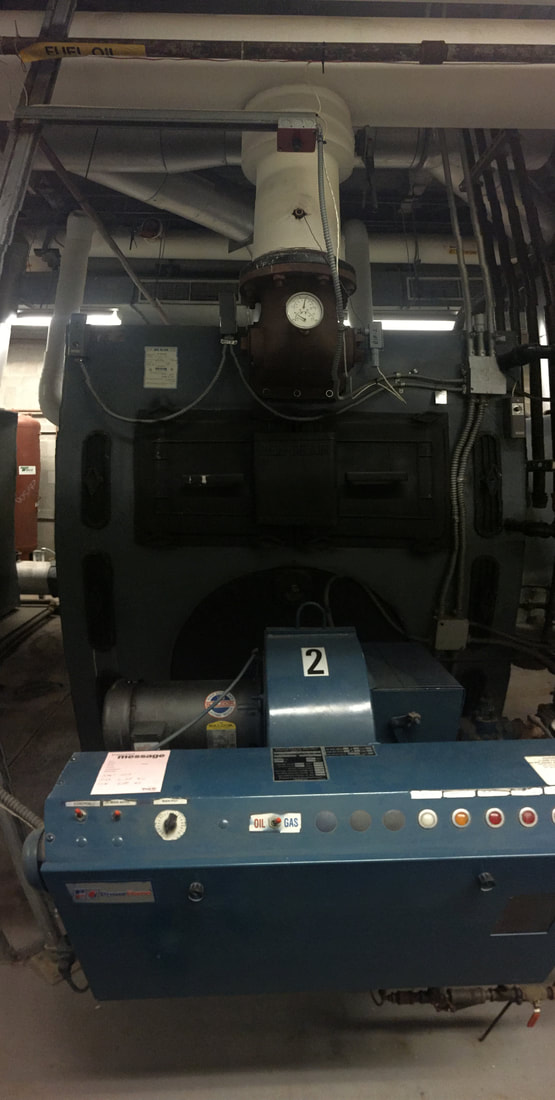
The control panel on a boiler
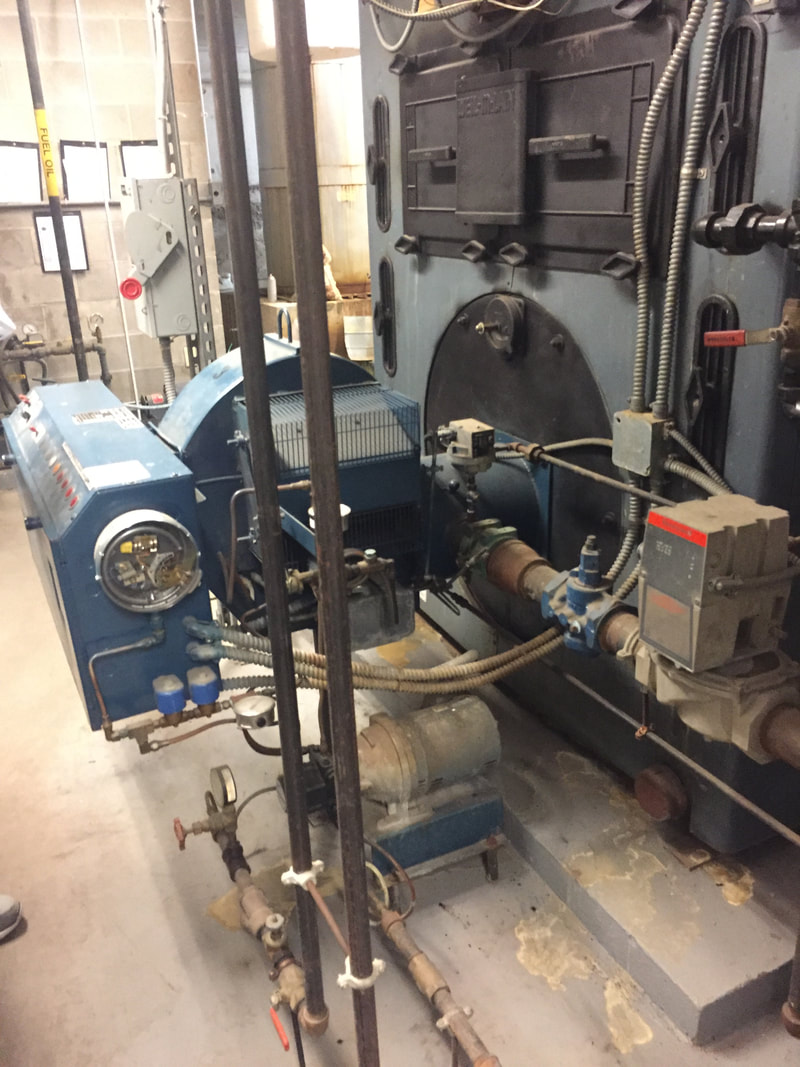
A boiler
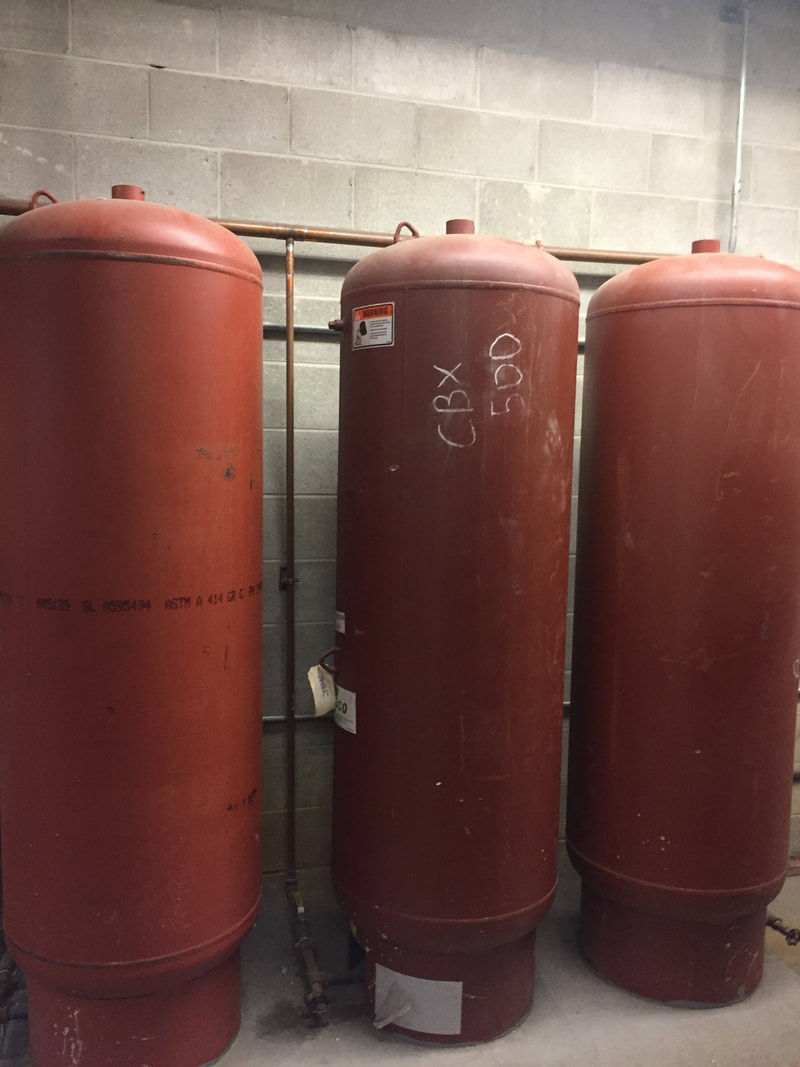
Tanks of compressed air
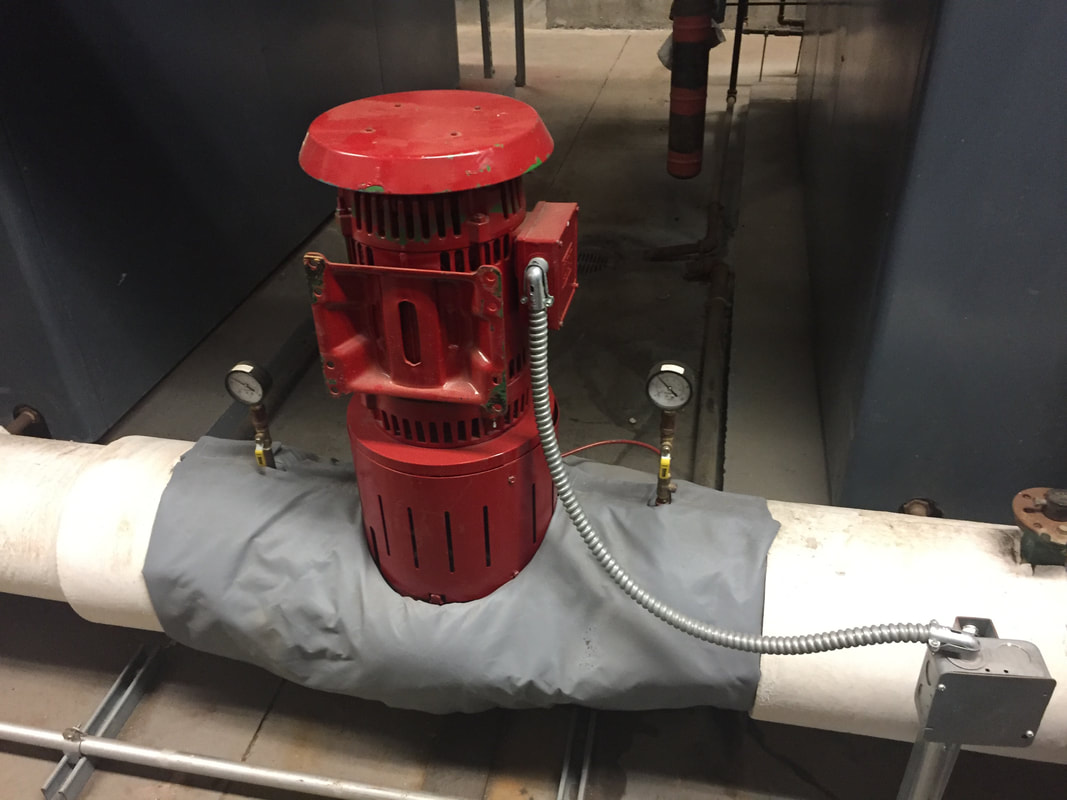
A water pump
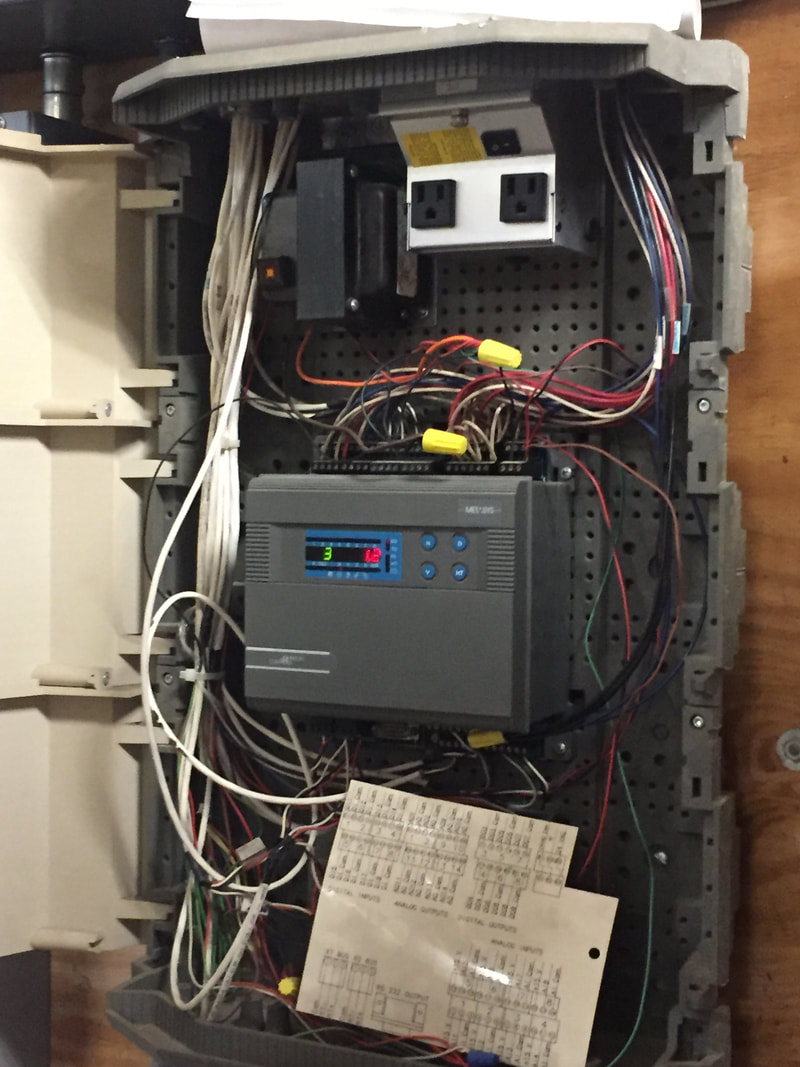
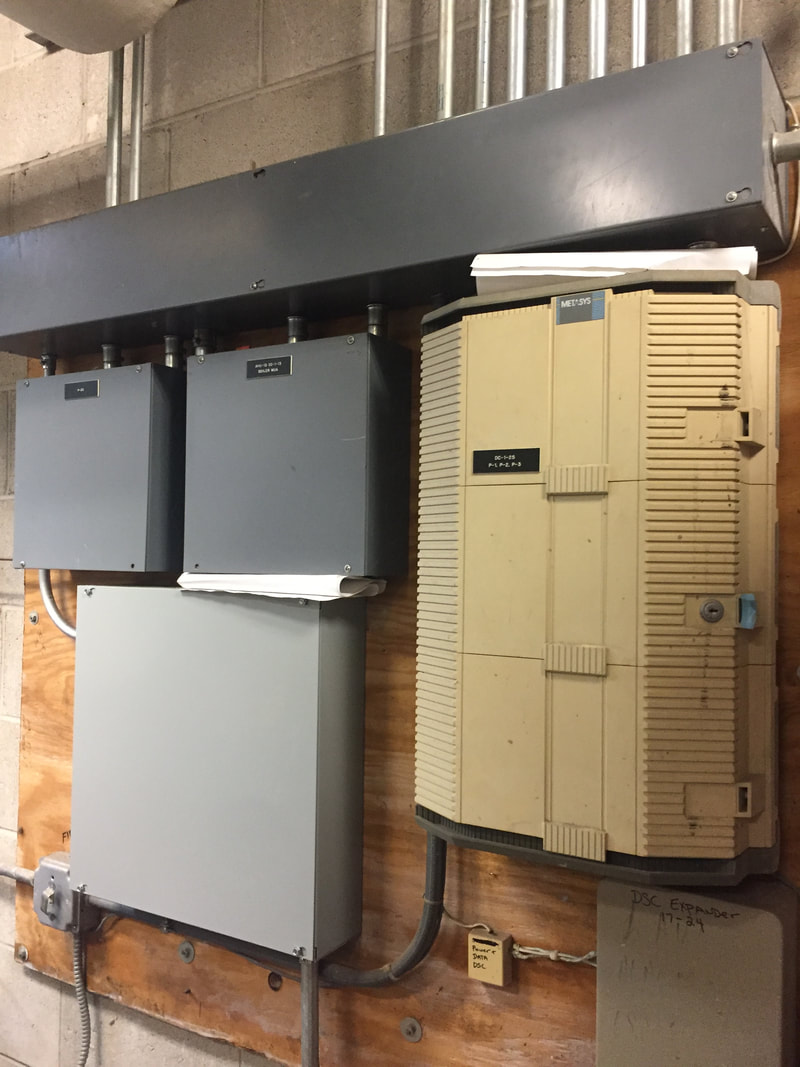
Control panels in the boiler room
The sprinkler control system
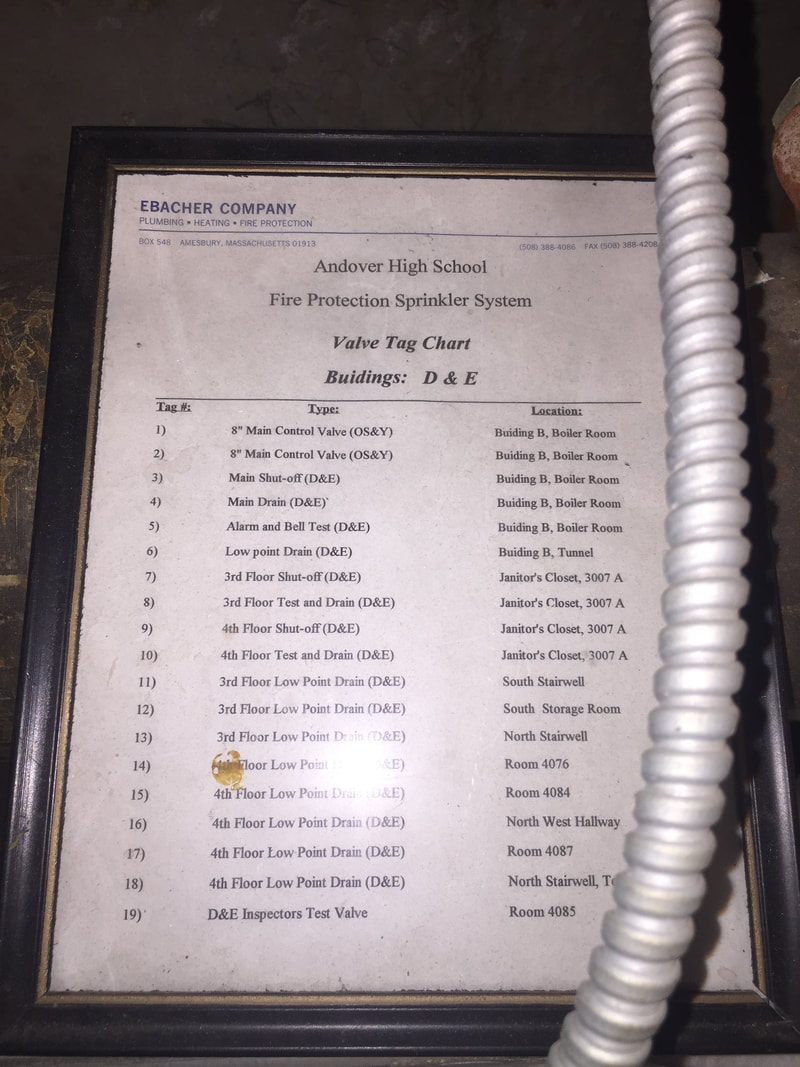
A list explaining which sprinkler controller controls which rooms
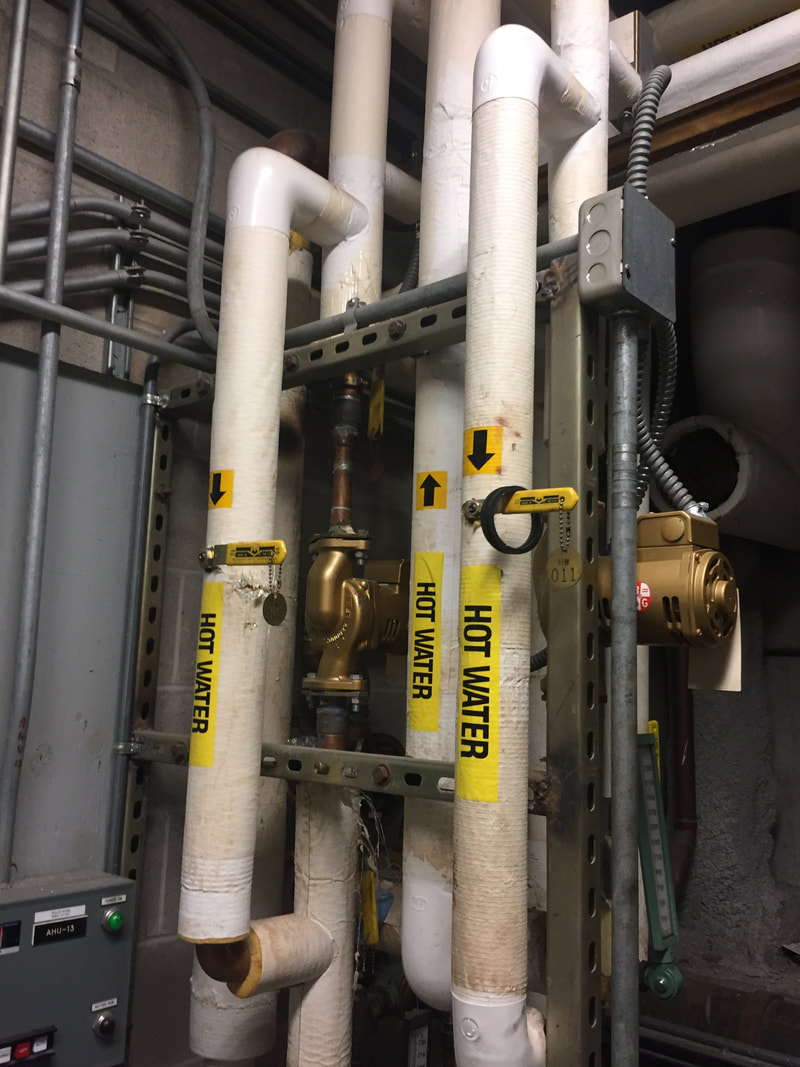
Hot water pipes in the boiler room
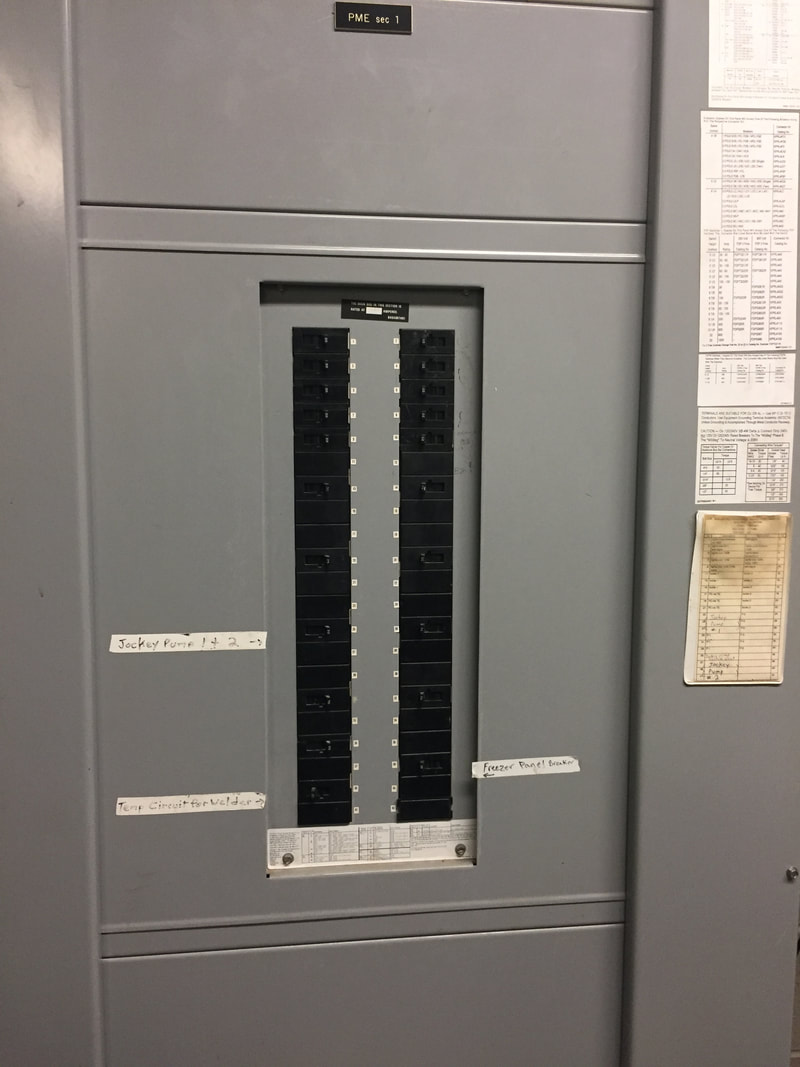
A switchboard in the boiler room
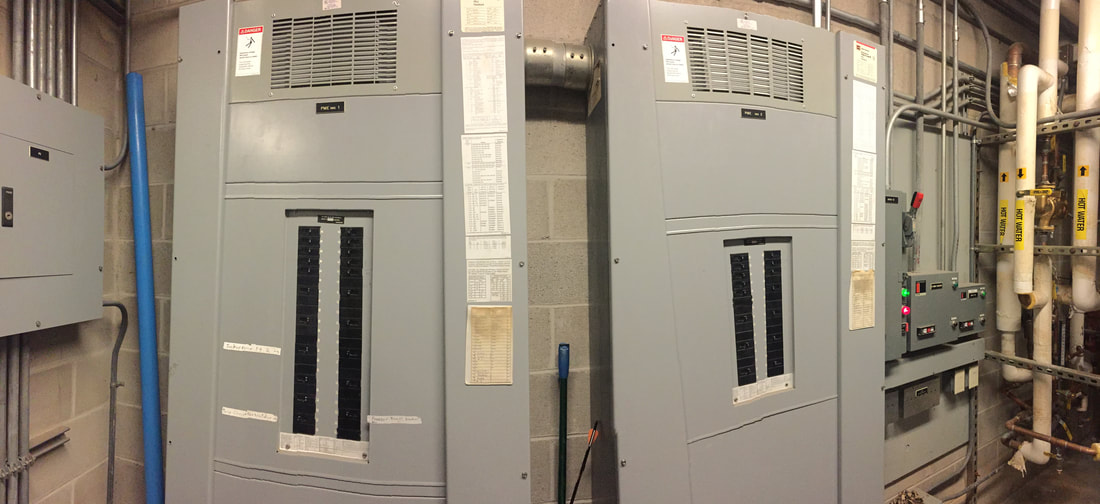
2 panels of circuit breakers in the locker room
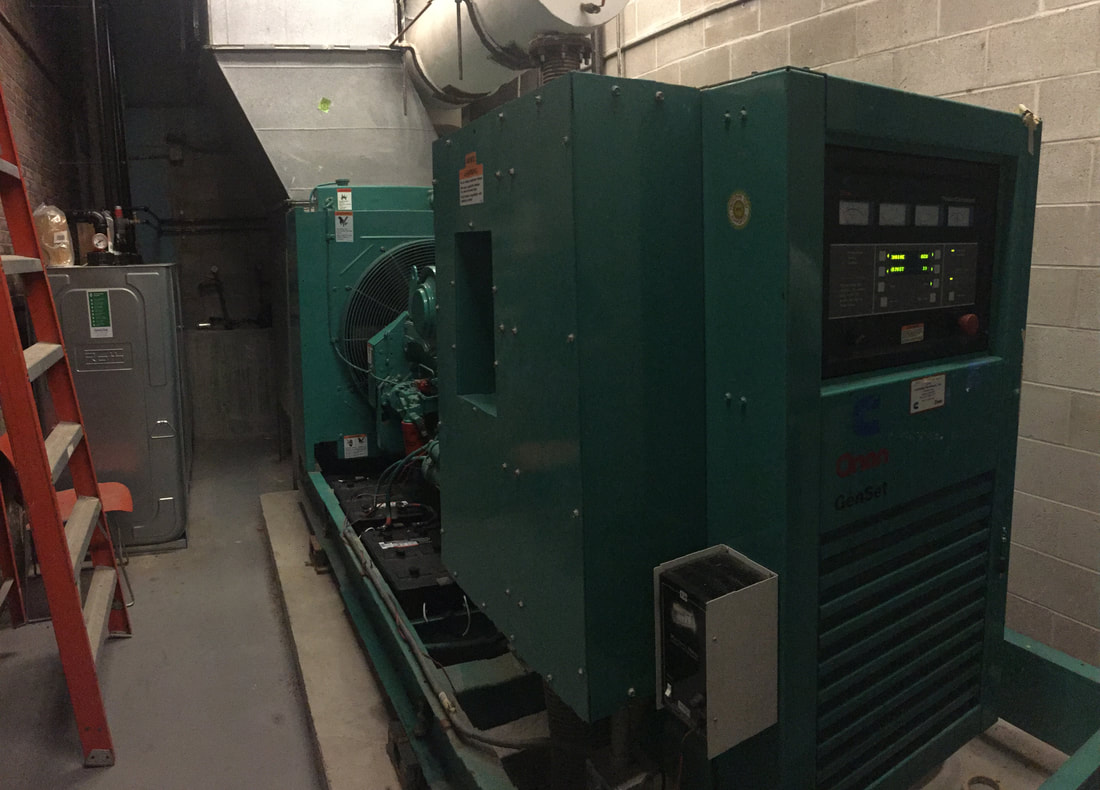
The automatic generator
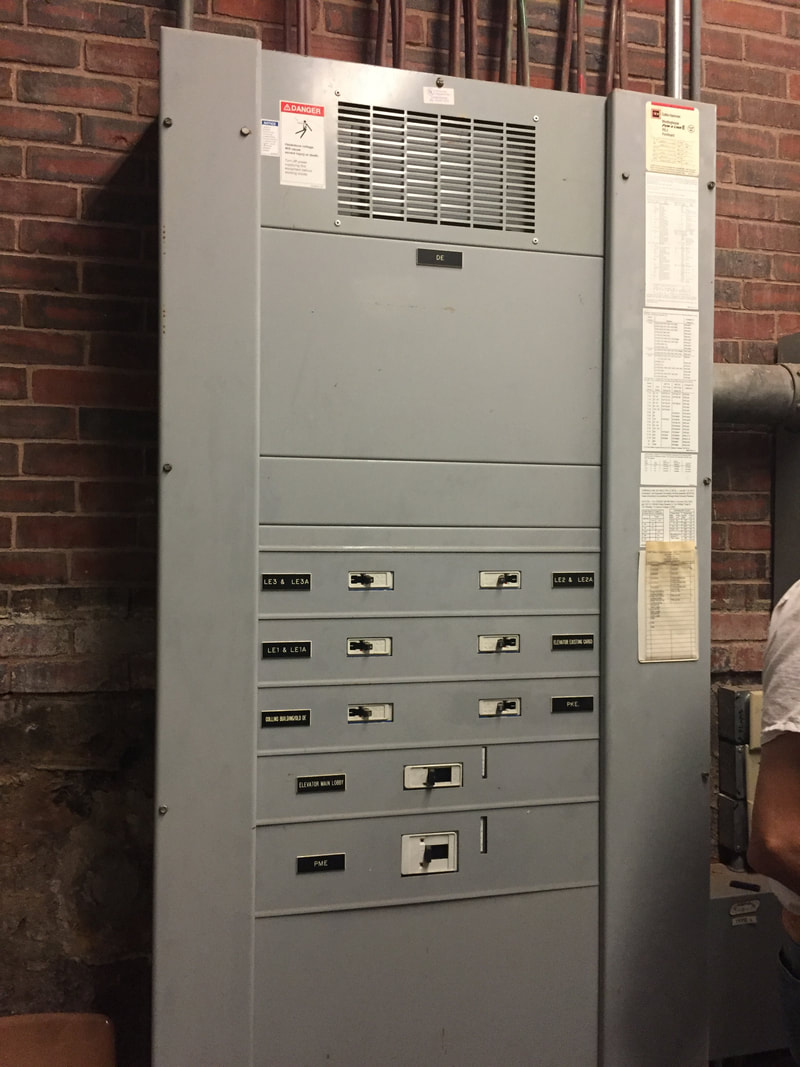
A circuit breaker panel located in the generator room
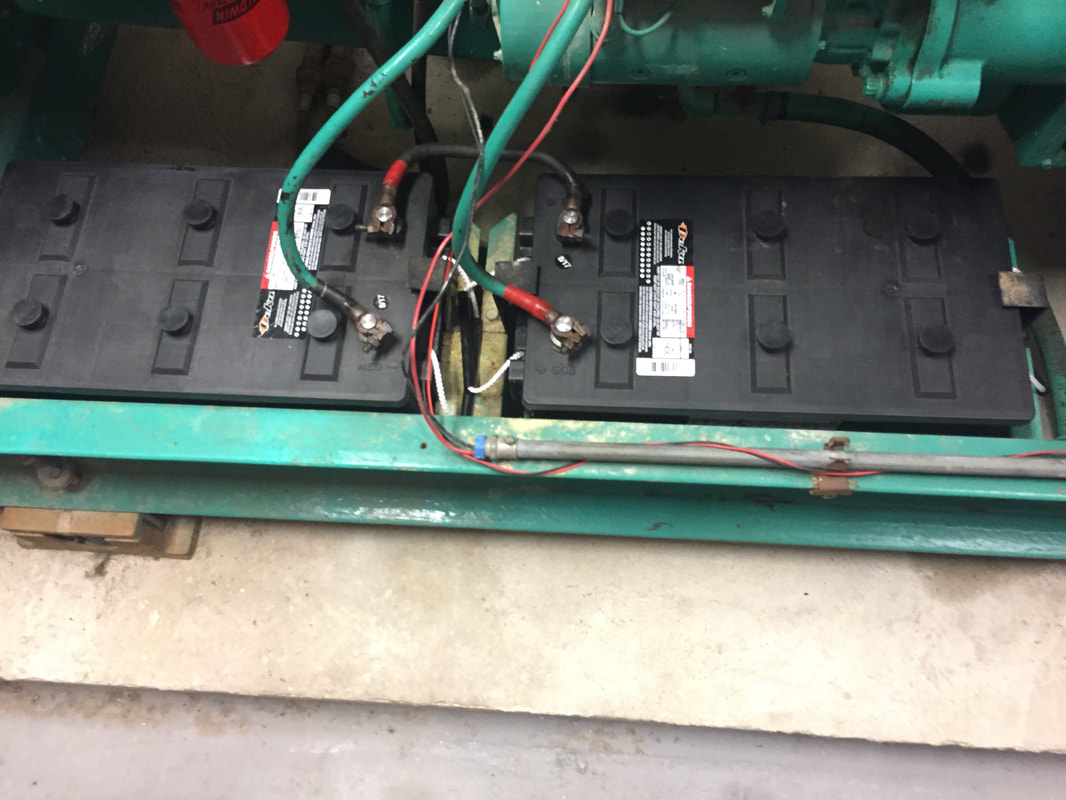
The two batteries that help start the generator
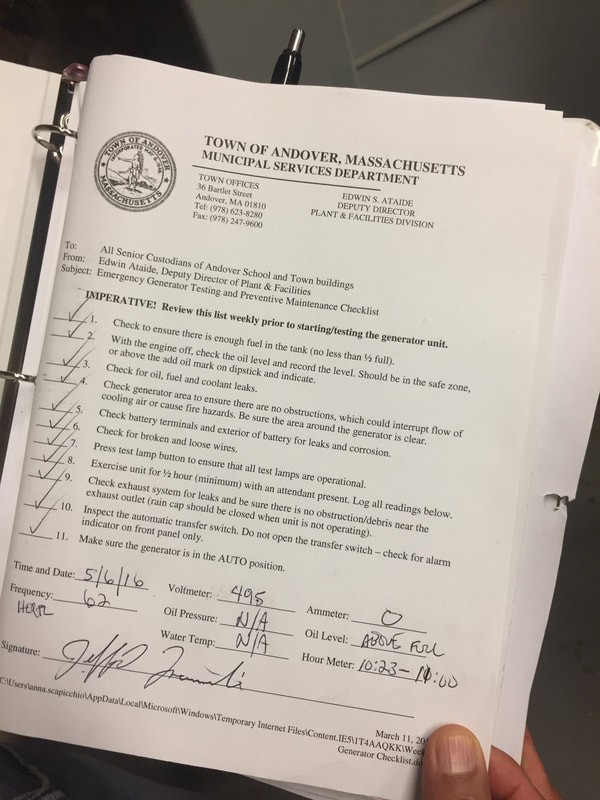
The checklist used when inspecting the generator
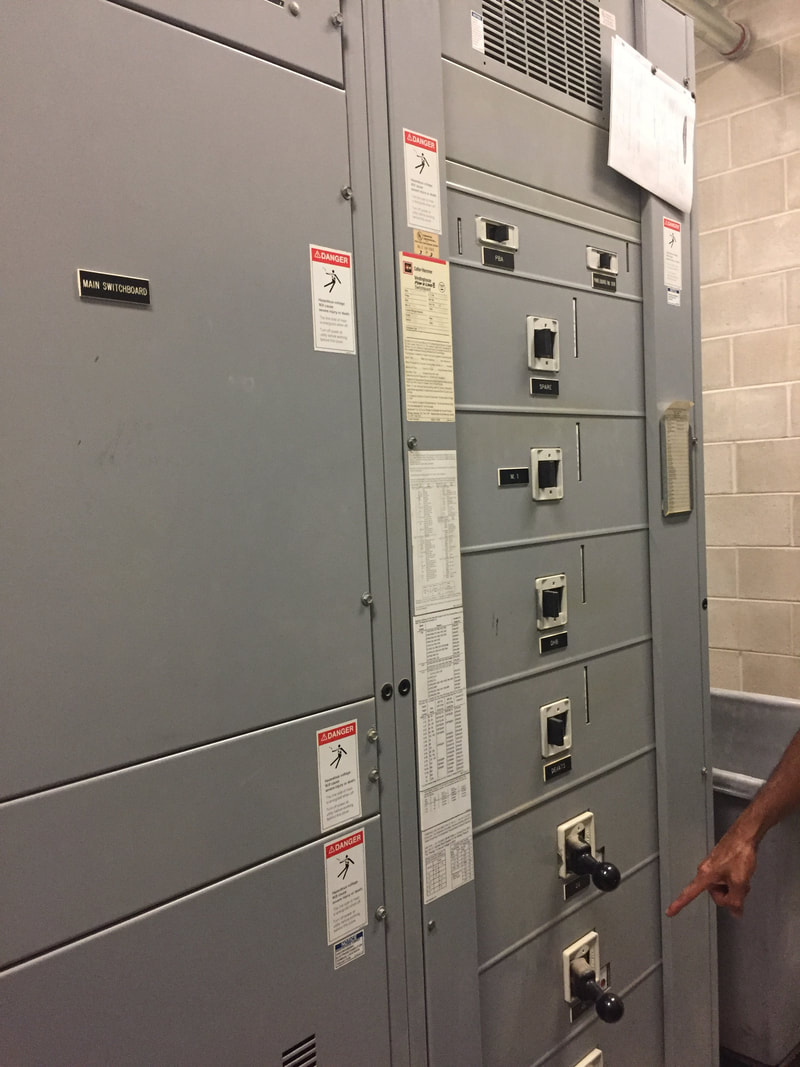
Part of the massive switchboard in the switchboard room
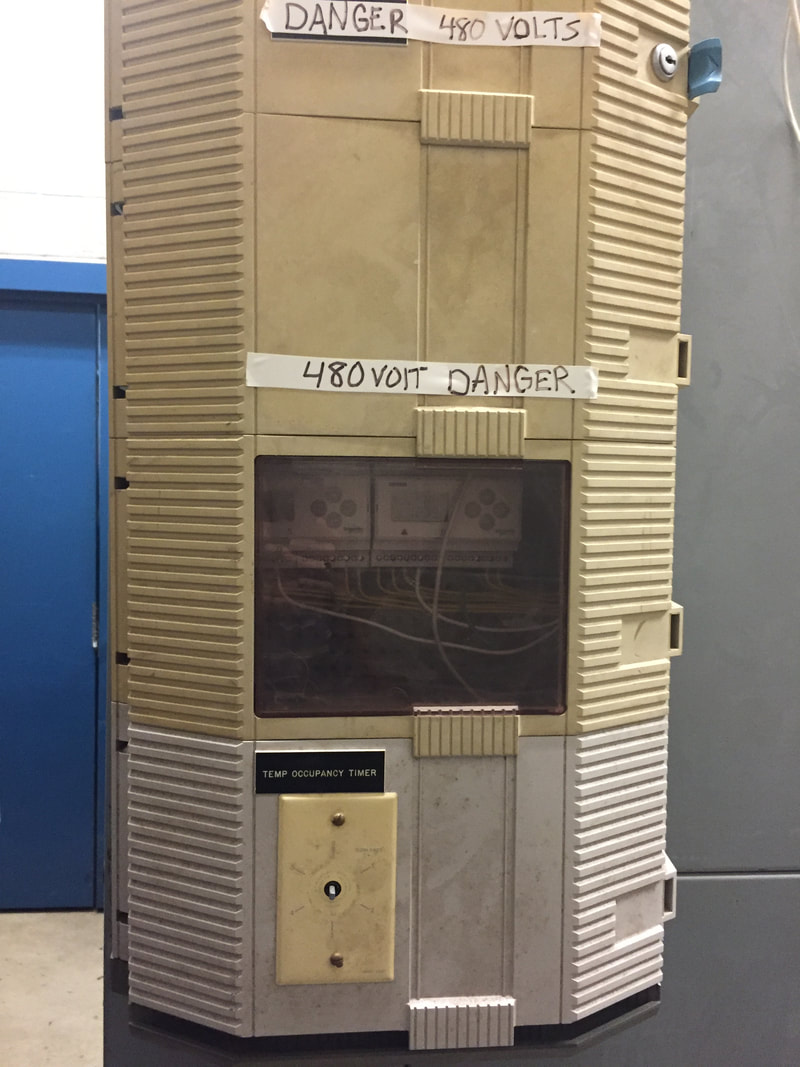
A panel in the switchboard room that contains the tools we use to get electrical data
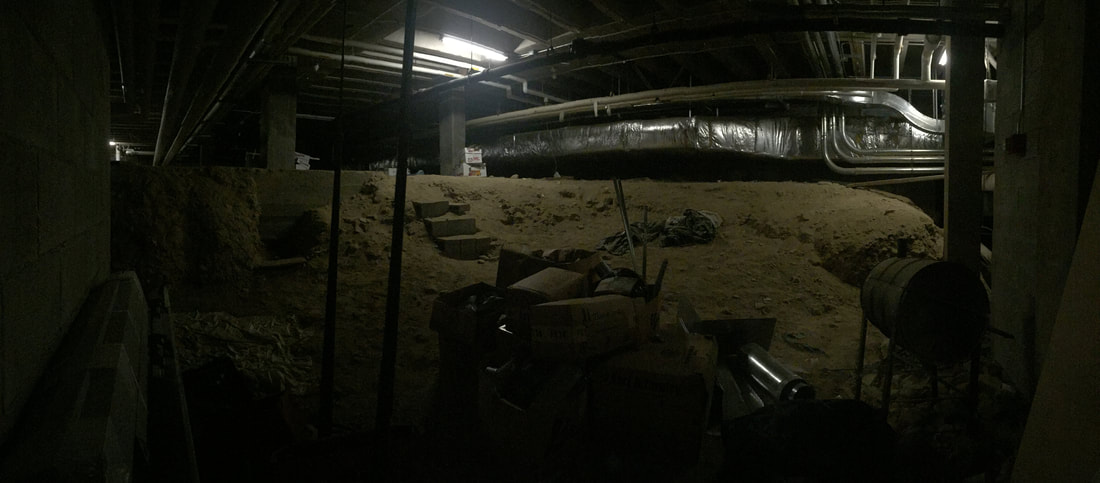
The inside of the mysterious dirt room.
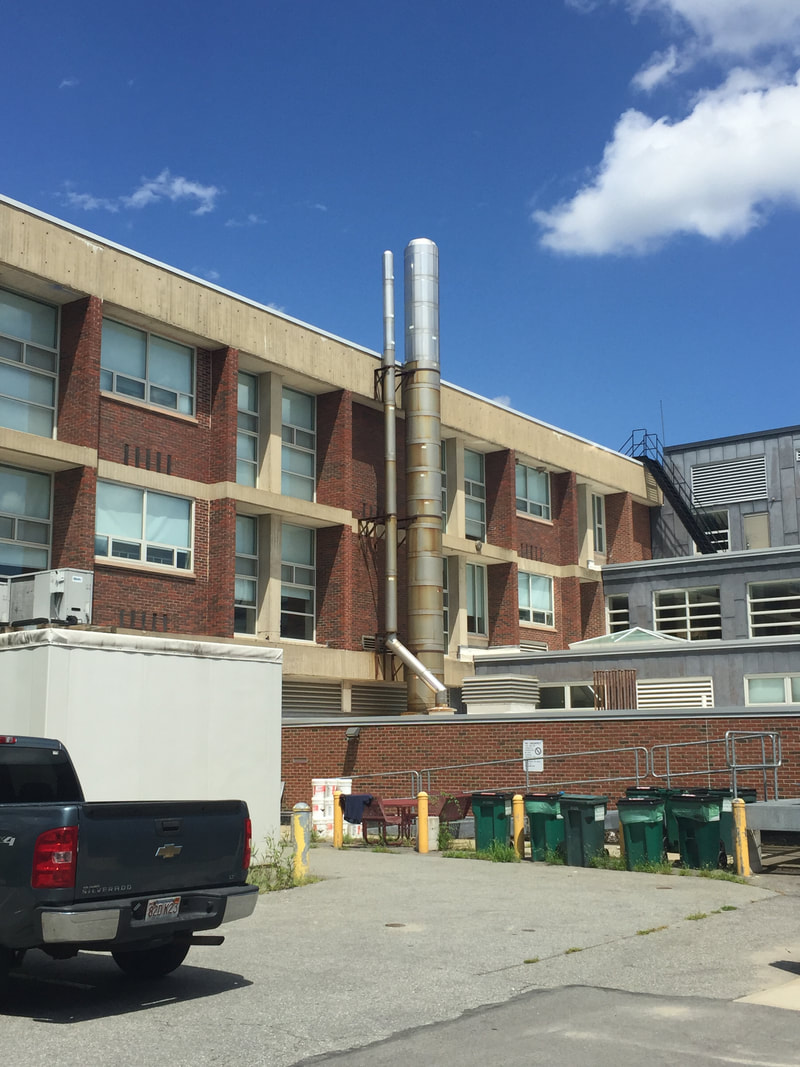
The boiler's chimney
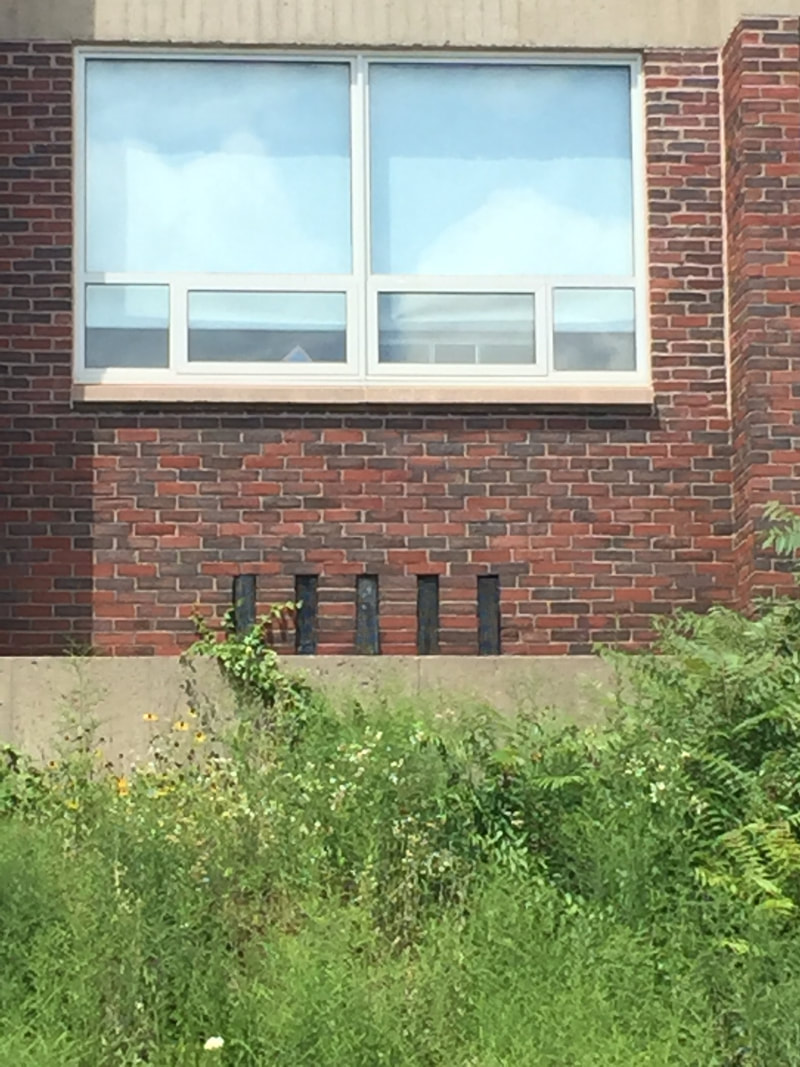
Vents outside a classroom
Finally, I created a GitHub organization for Energize Andover, called Energize-Andover. We will be posting all our projects there from now on.