Building Energy Boot Camp 2018 - Day 11

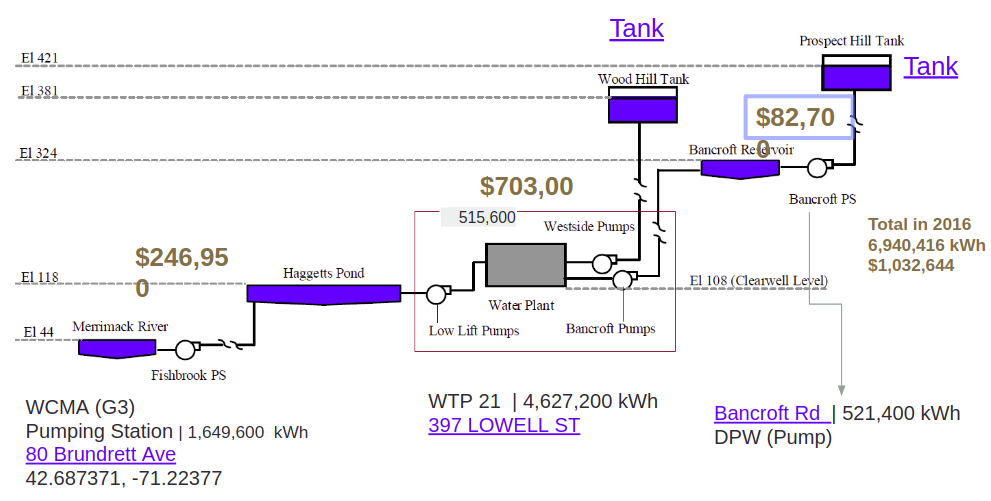
Today, we learned about our town’s water, specifically where we get it and how and where we use it. You can see maps and charts from our lesson below. In addition, I edited my code for the DataDisplay. I changed the timestamp at the bottom of the GUI to use the last time saved instead of the first, as otherwise, the timestamps could be off by more than a half minute. Afterwards, we began working on our final presentations and took a visit to our town’s water treatment plant. I took pictures and have uploaded them to the slideshow at the bottom of the page.
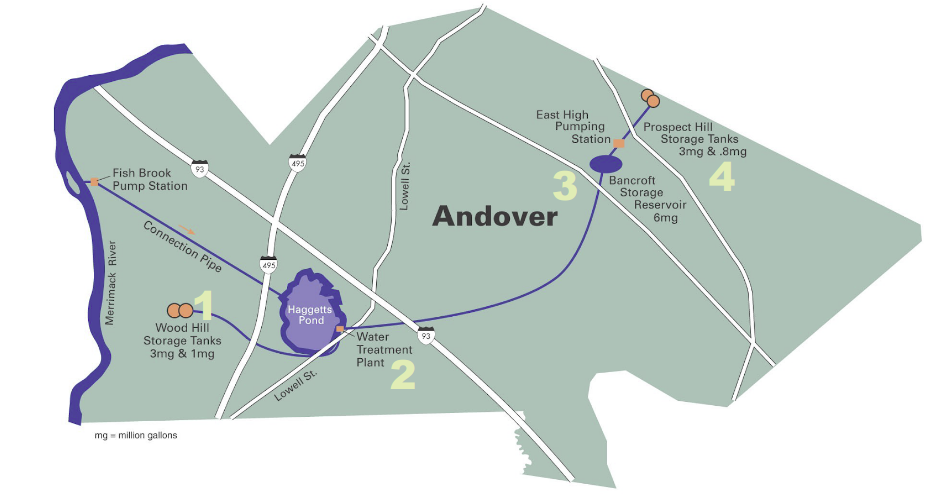
Utilizing what I learned earlier in the camp, I used Geosheets to make the following map of the water distribution storage facilities (based off the map above):
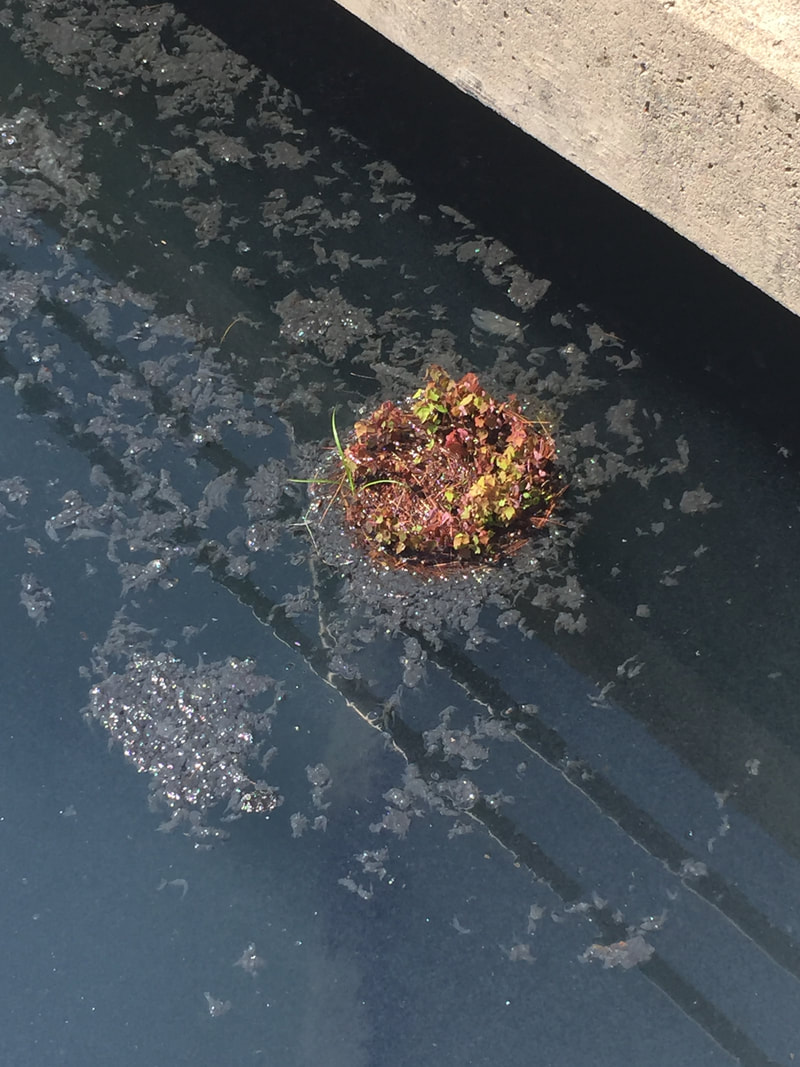
Plants growing on a chunk of floc
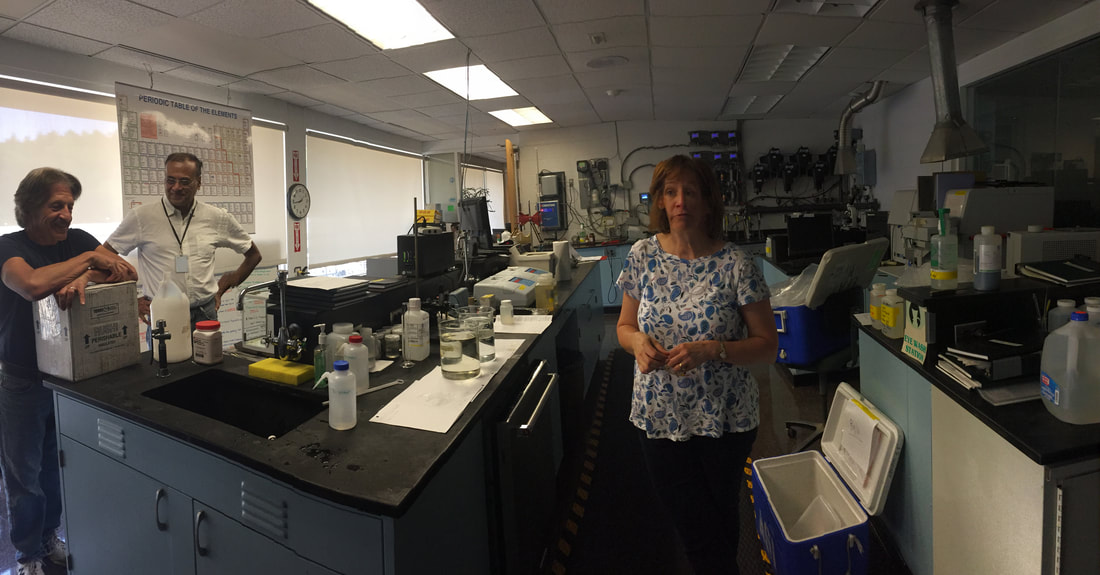
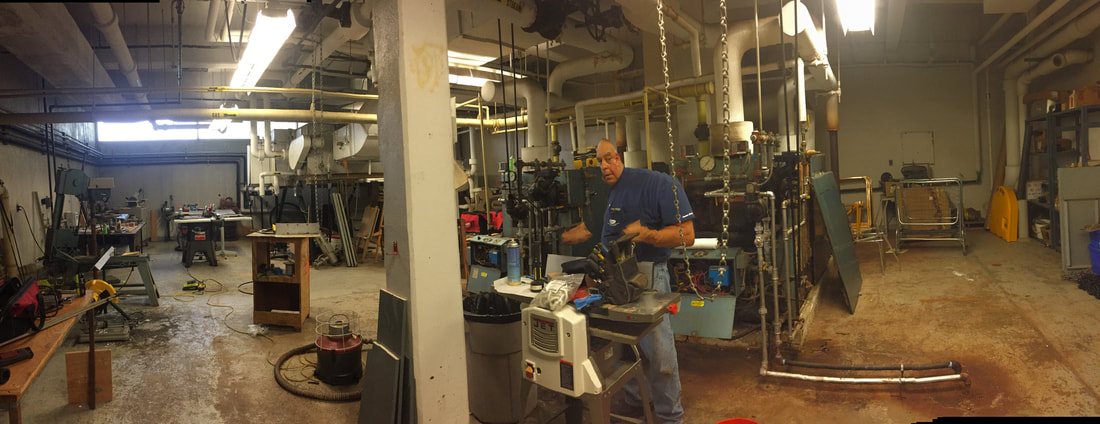
The lab
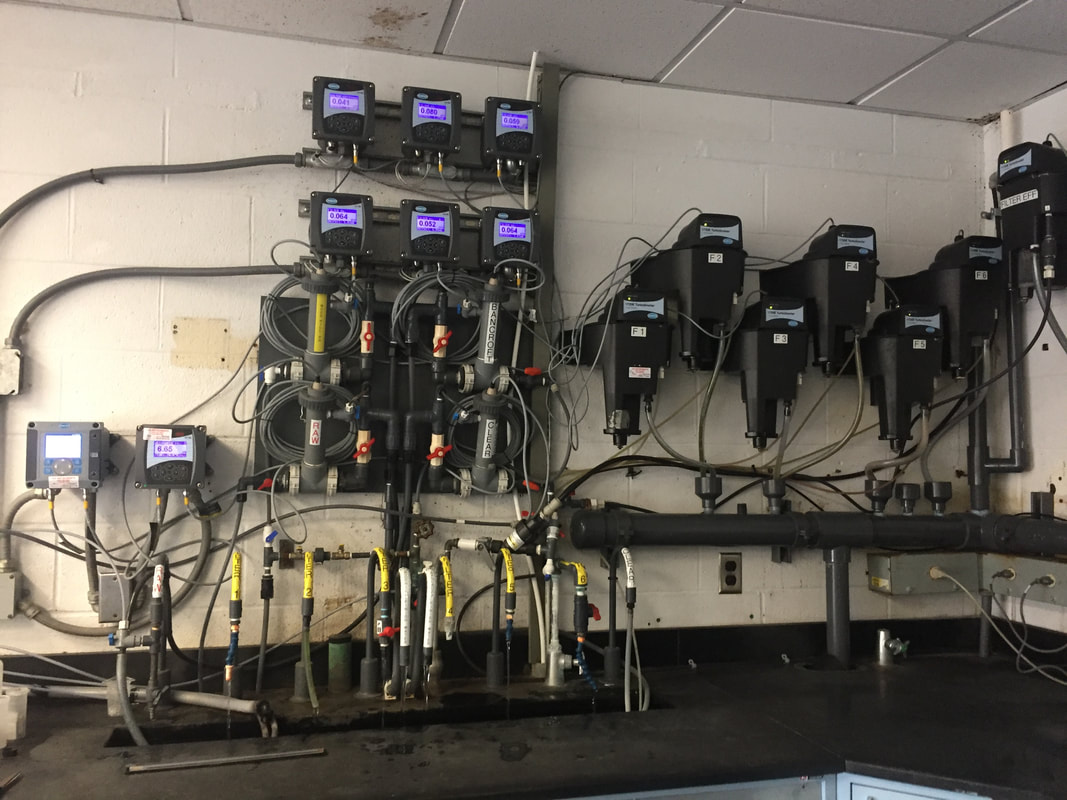
Various sensors in the lab
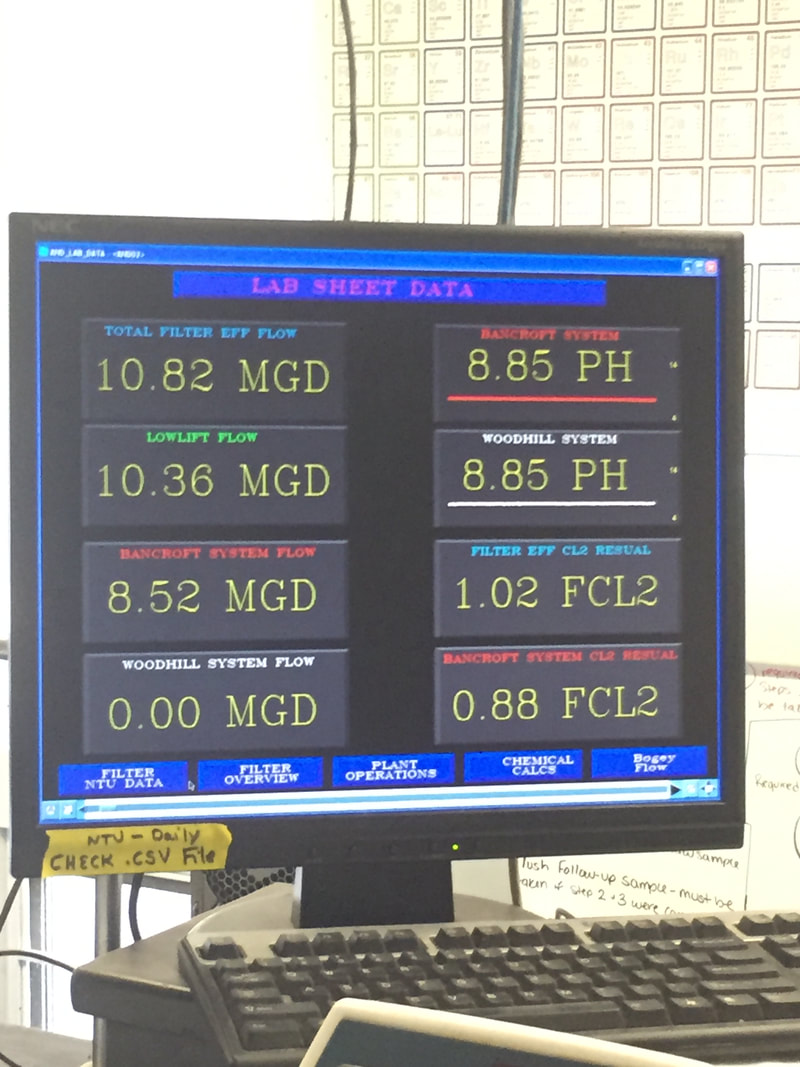
A monitor in the lab
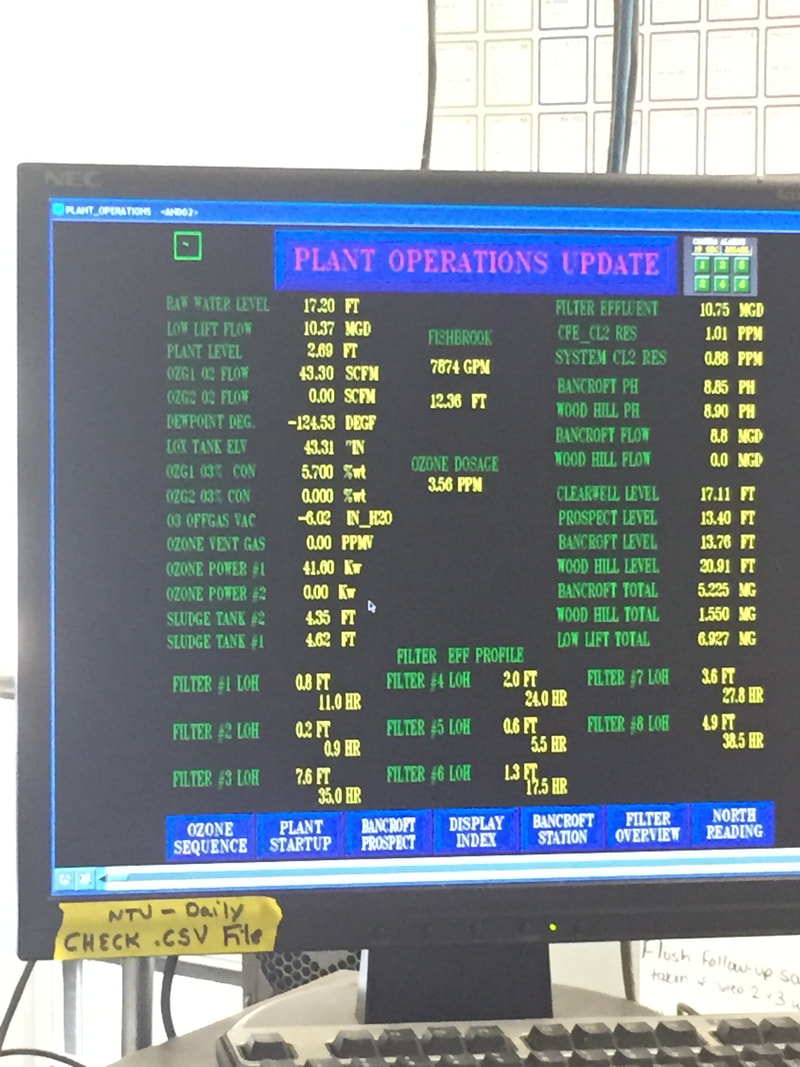
Another monitor in the lab
Chamber in the pump room
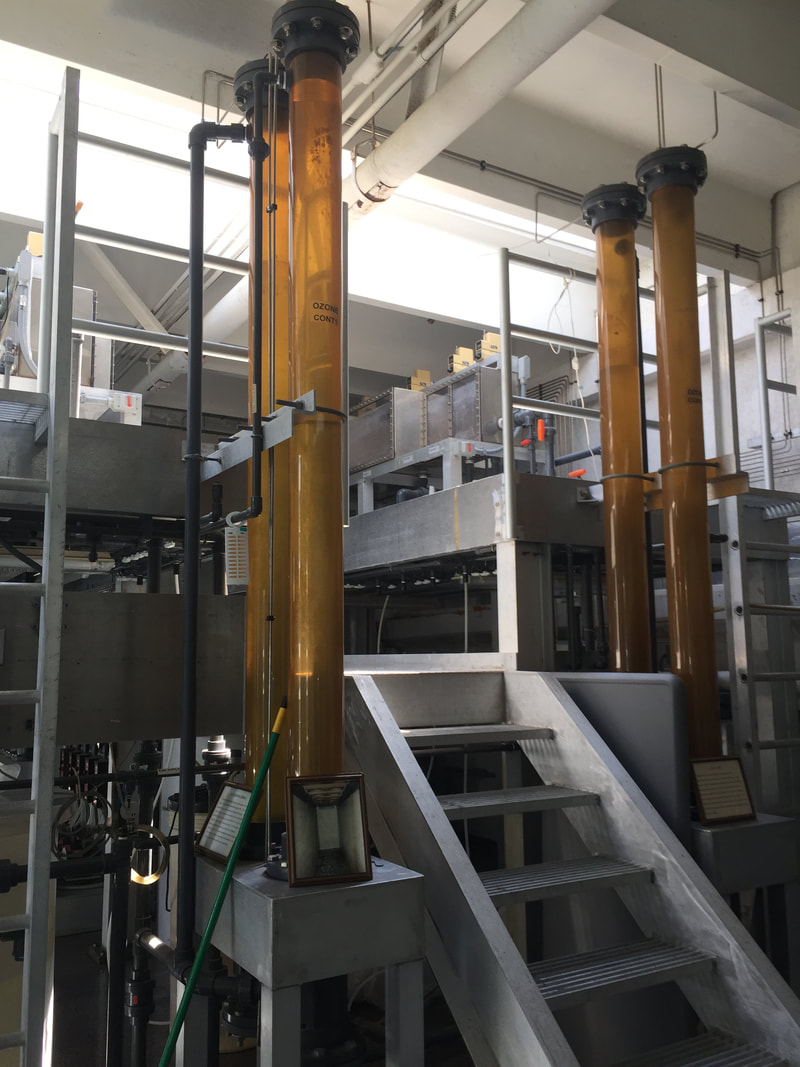
The pilot plant
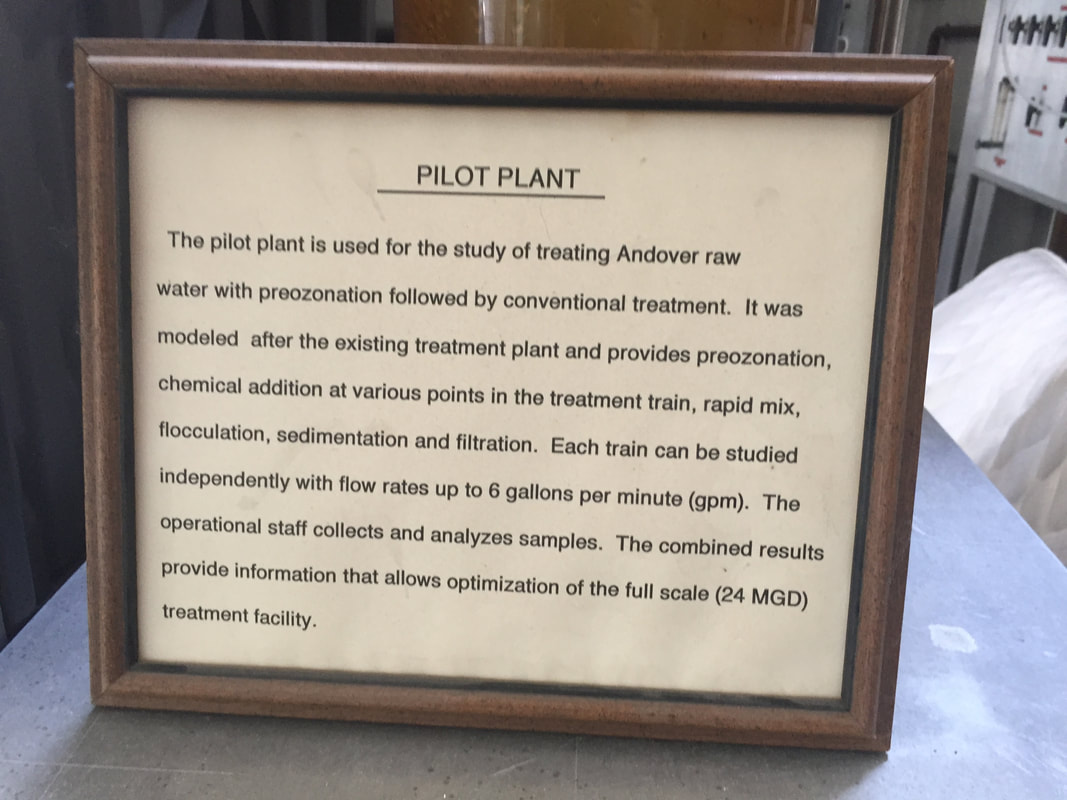
A description of the pilot plant
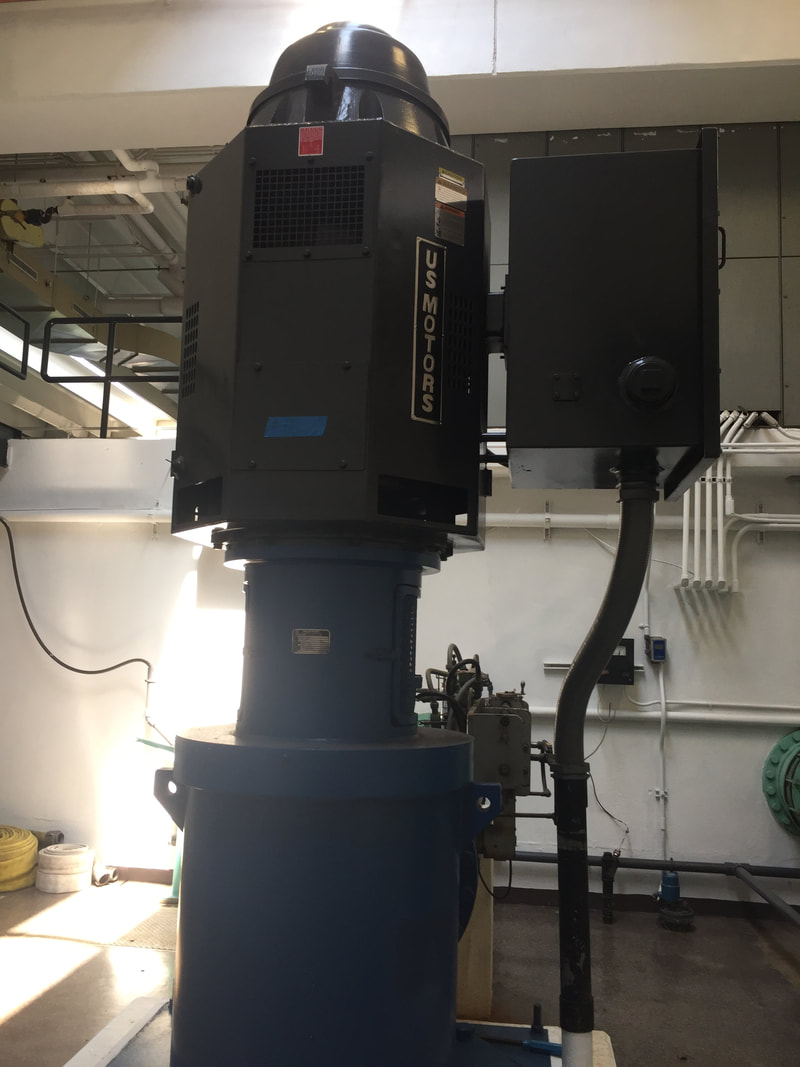
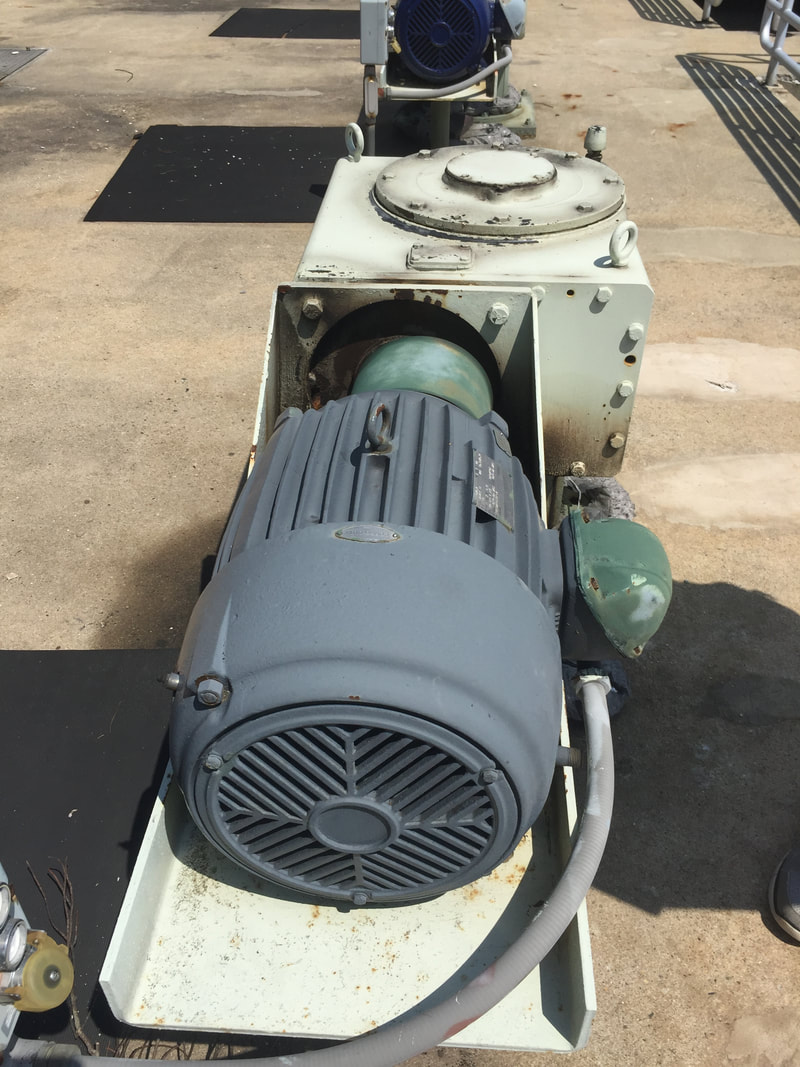
A pump
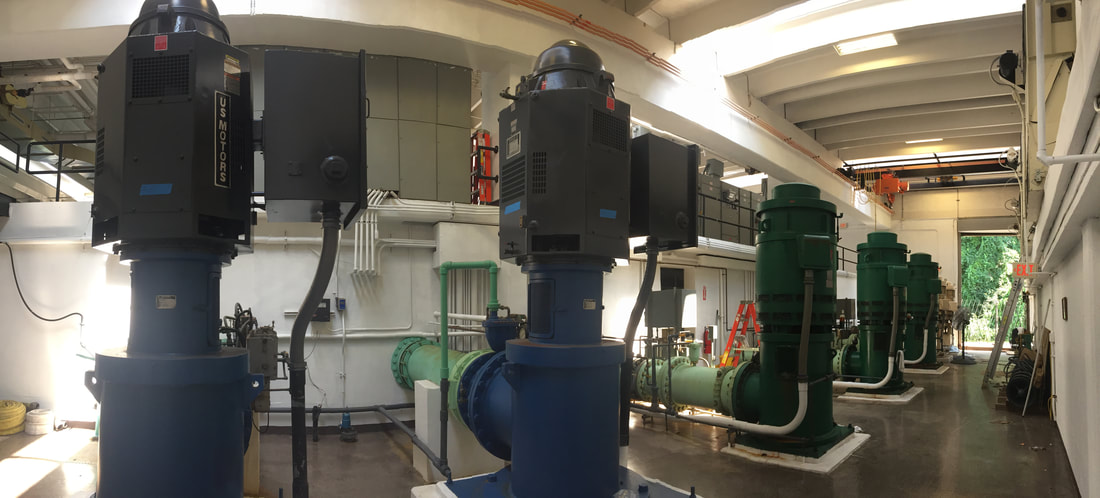
Pumps
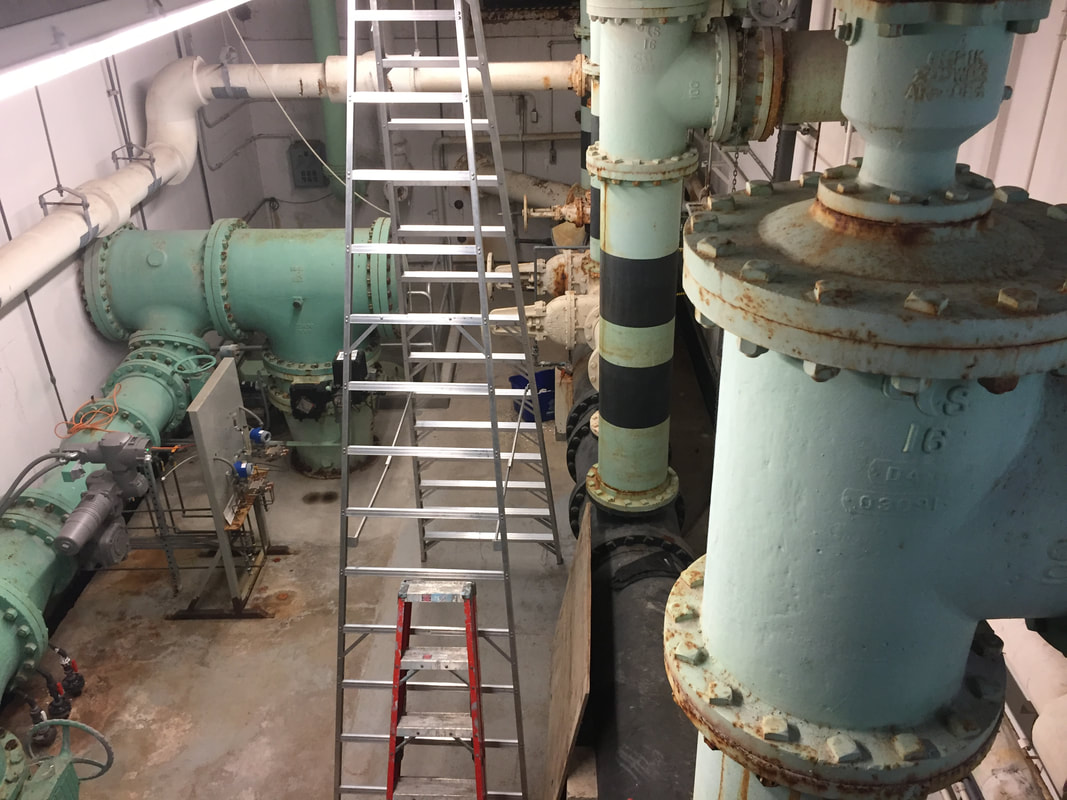
Pipes
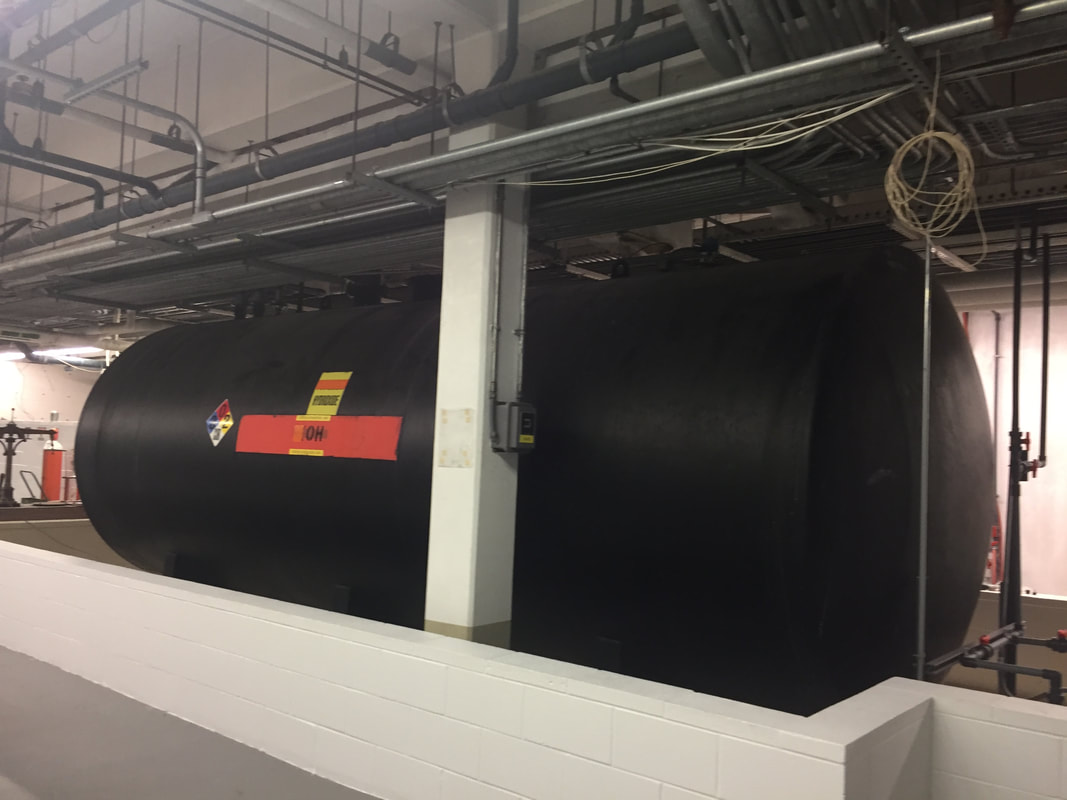
A caustic tank
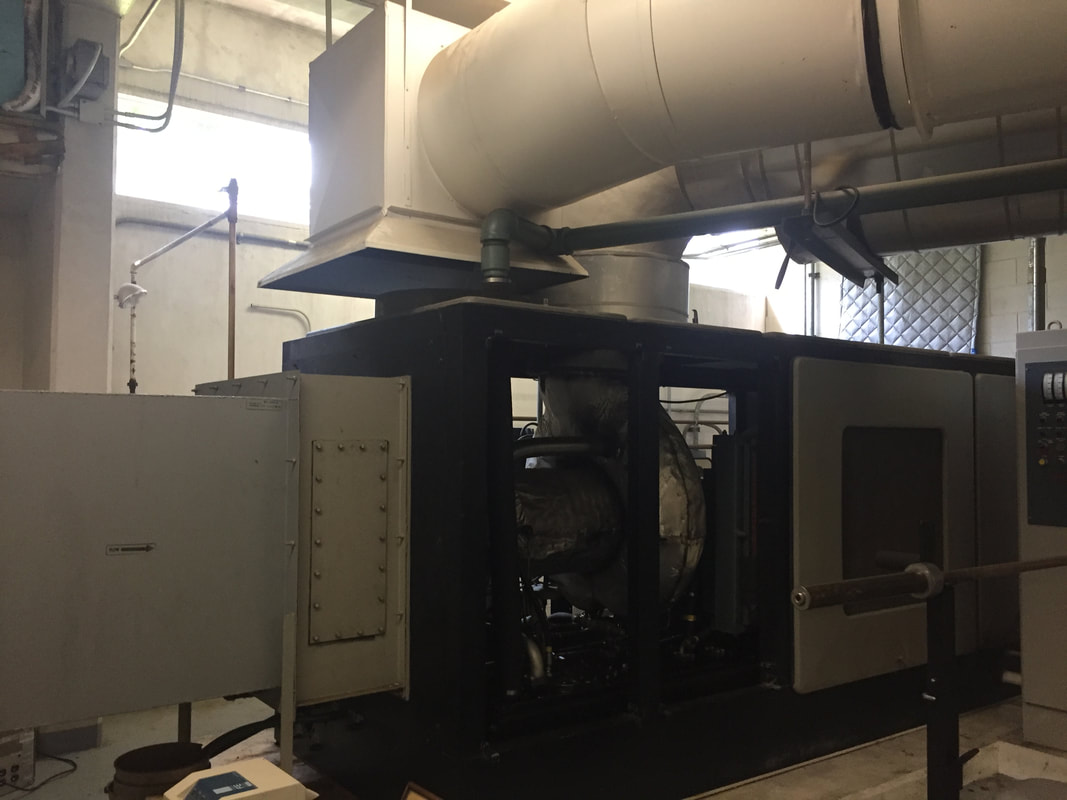
The plant's emergency generator - the solar saturn generator
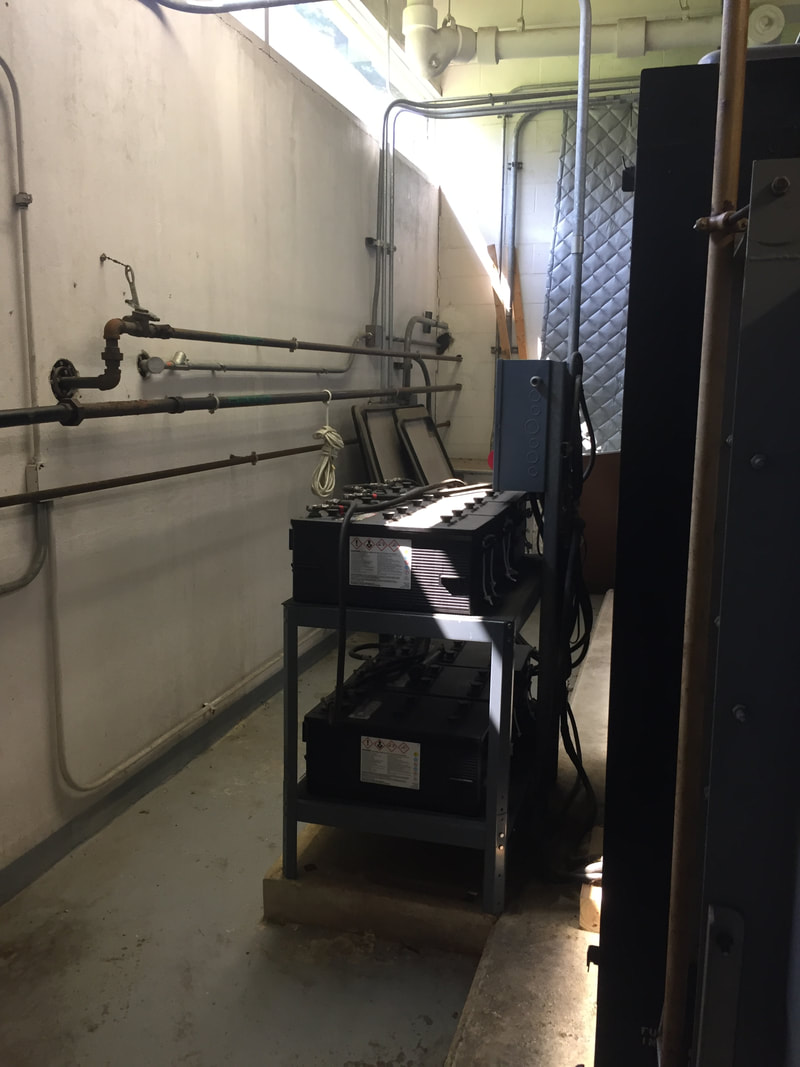
The generator's batteries
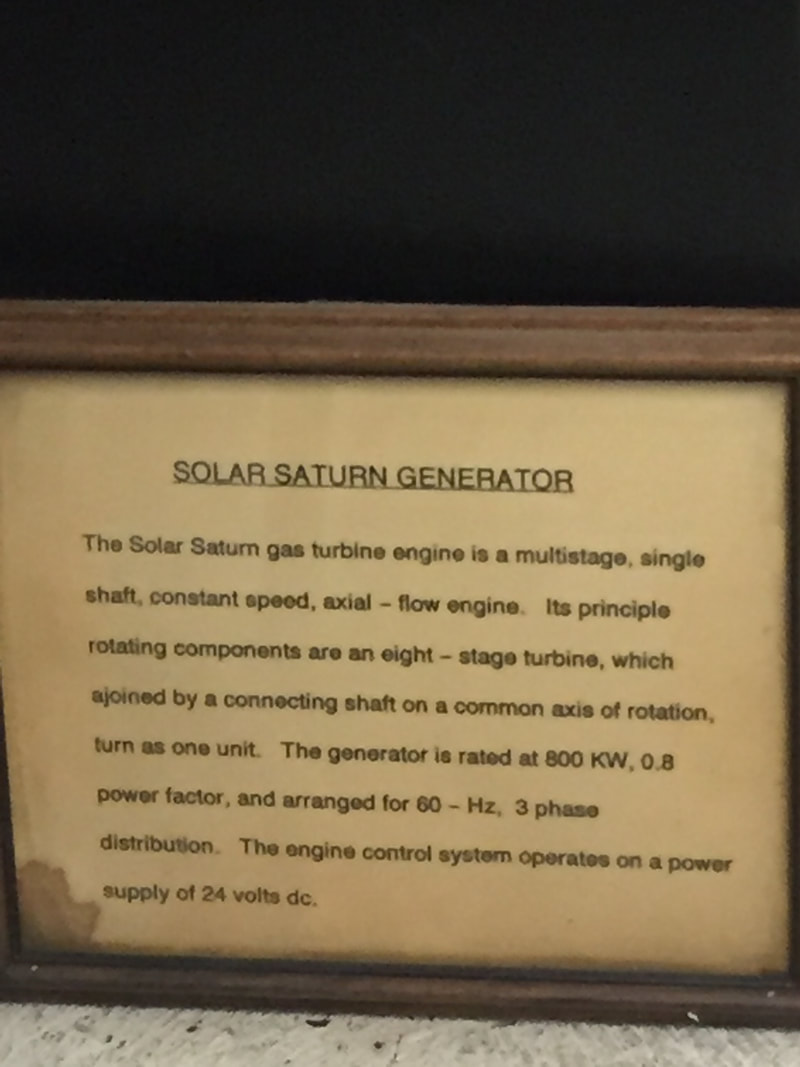
A description of the generator
The boiler room
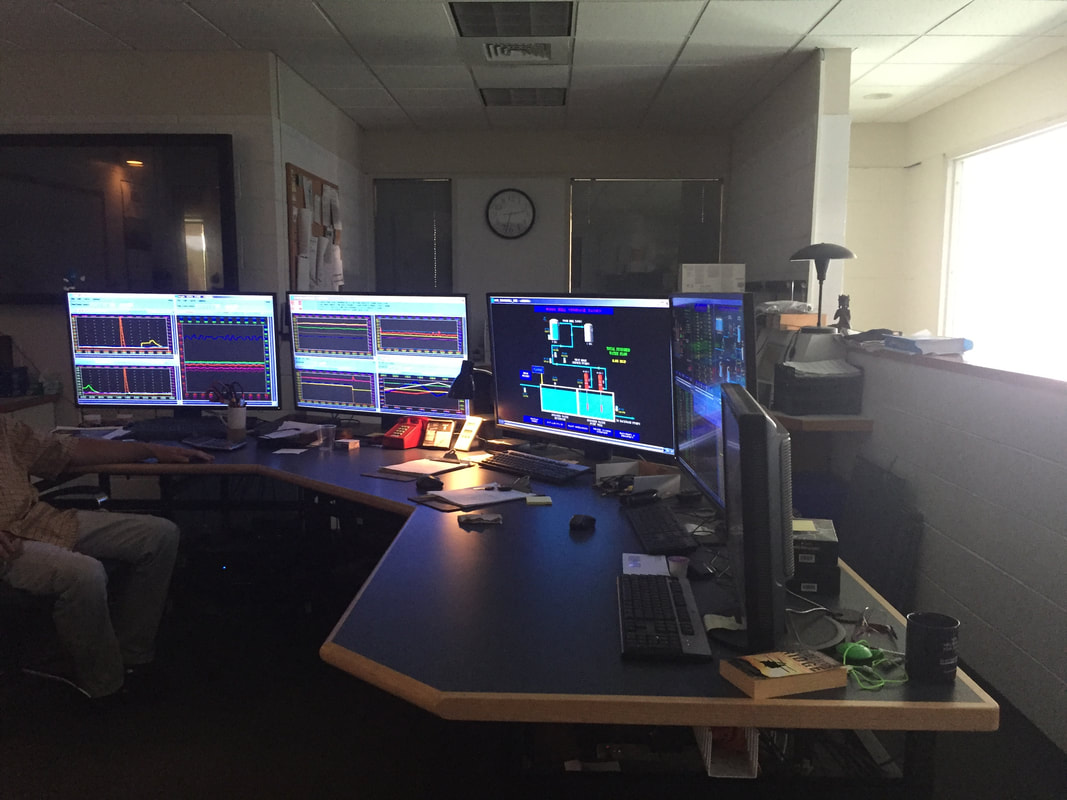
The control room
A mixing pump
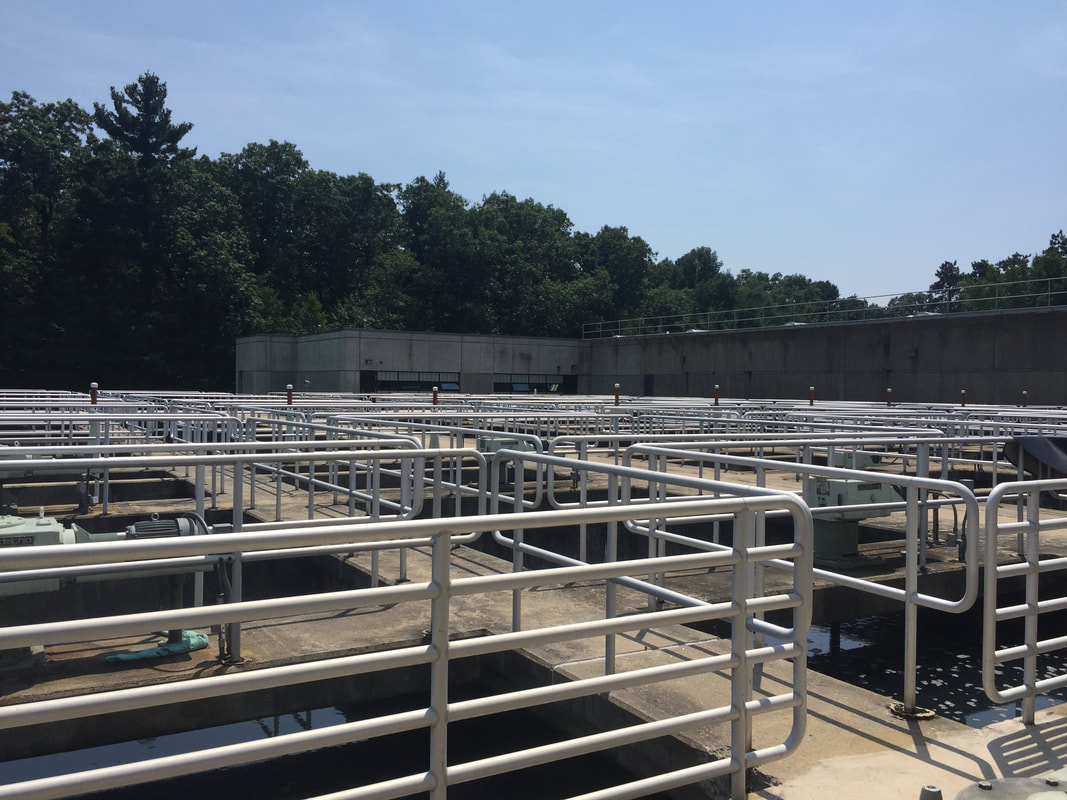
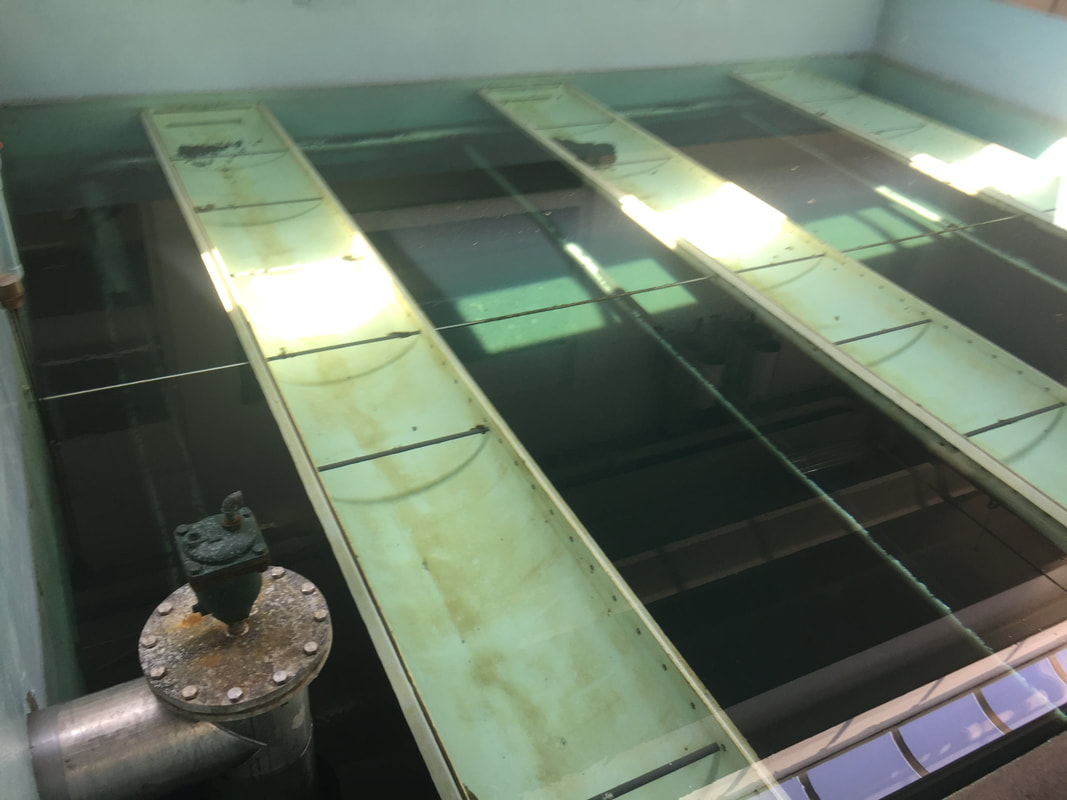
Flocculation chambers
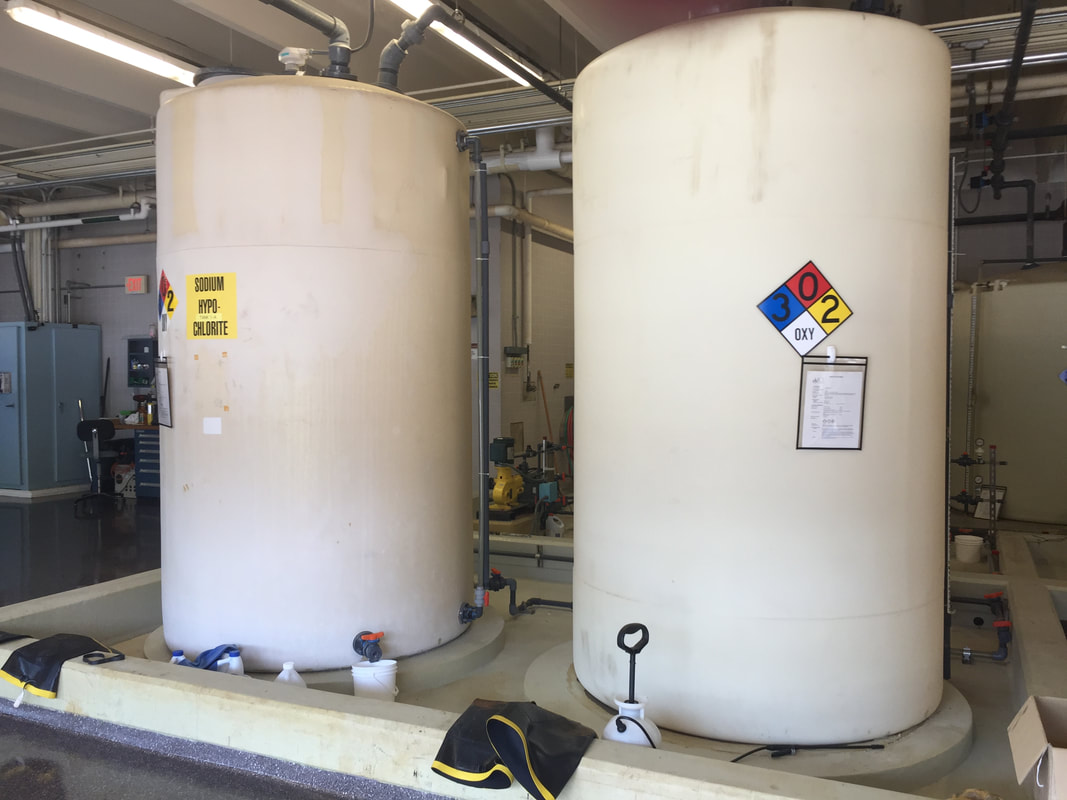
Chemical tanks
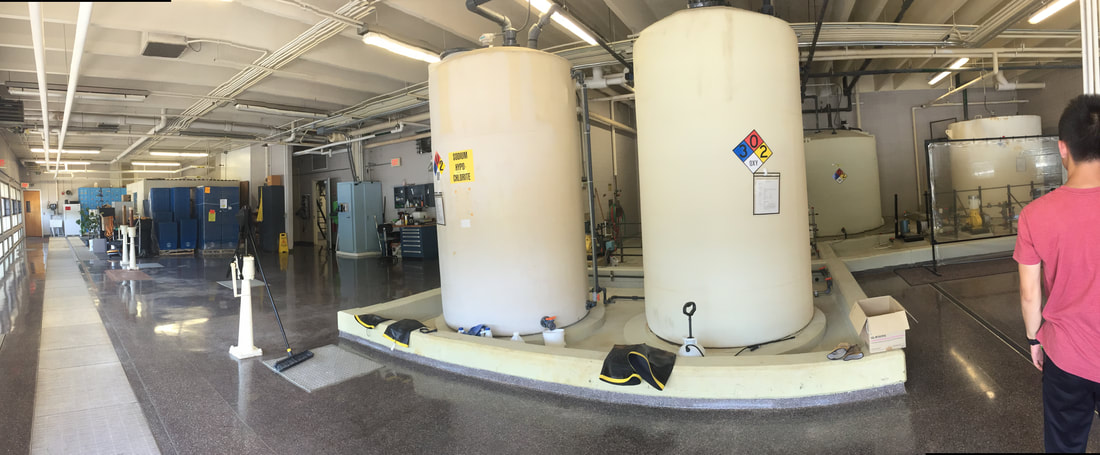
The chemical storage room
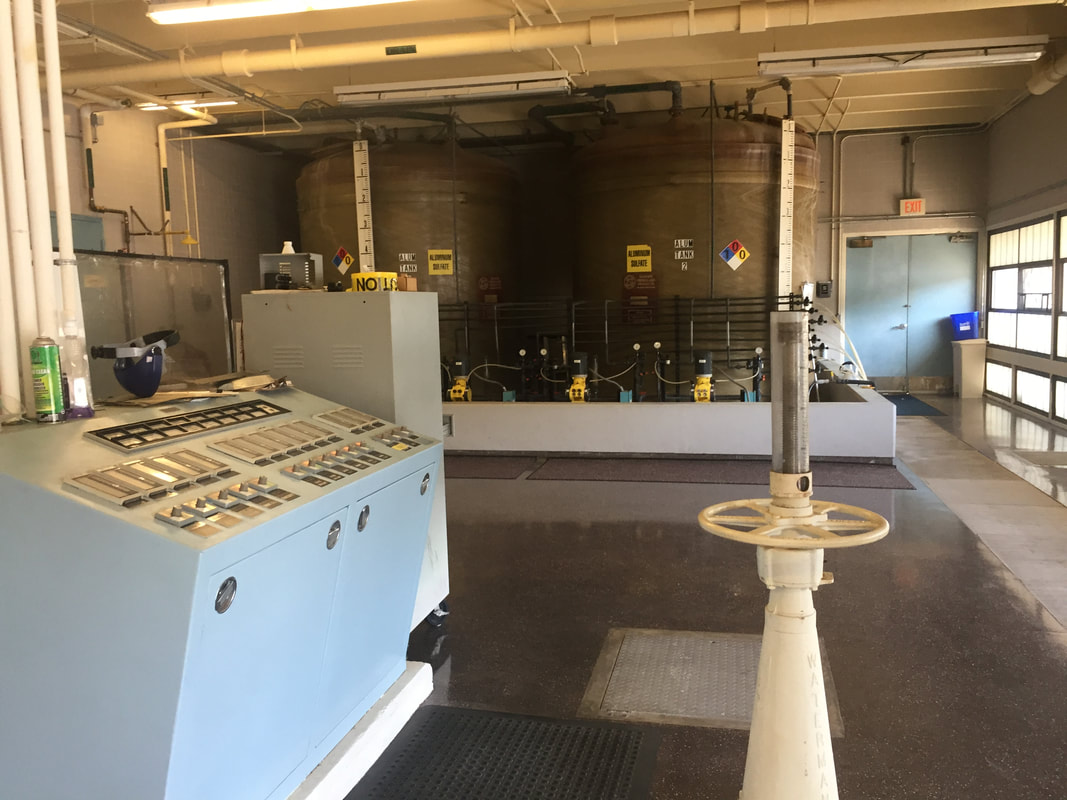
The chemical storage room
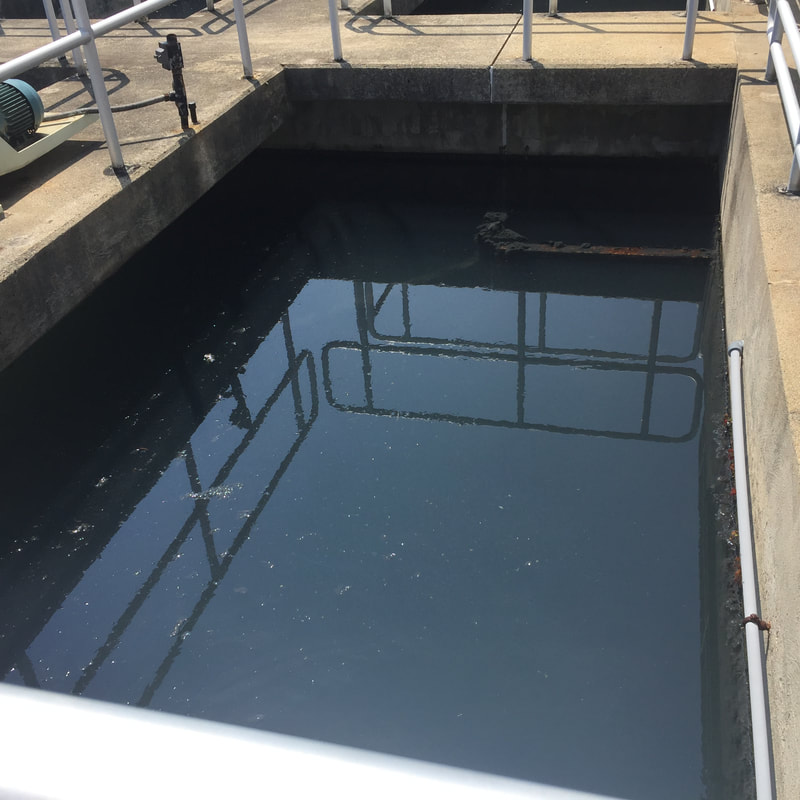
A flocculation chamber