OpenCV and AHS Heatmap | Autonomous Room Detection in Floor Plans With OpenCV (Part 3)

This is part 3 of a series of blog posts about the computer vision behind the AHS Heatmap. Read part one here; Read part two here
In this final part of this series, I will explain how OpenCV is used in combination with the files and data obtained from the steps described in parts one and two in order to generate the final heatmap.
Processing the Generated PNG With OpenCV
By analyzing the filename of the original SVG, the Python was able to detect the floor of the school that it is currently generating a map for. The first digit of room numbers in AHS indicate their floor (for example, room 203 is on the second floor). Thus, the program can use the floor number to filter the pandas dataframe associating the addresses of AHS’s sensors and their room numbers. The program then iterates through this cut-down dataset and compares it with the dataset of text boxes and coordinates obtained in part two. If a sensor’s room is not labeled on the floor plan (that is to say, if a room number from the sensor dataframe is not found in the PDF dataframe), the room is skipped. If not, the temperature or CO2 level of the sensor is pulled, a proper color between blue, green, and red is chosen, and the following process is performed to detect the shape of the room:
Detecting Room Shapes
To demonstrate this process, let us say that the program is currently looking for room 217 in the following floor plan (listed as “level 3” because the field house, a part of the first floor, was separately considered as “level 1” by the floor plan’s creators):
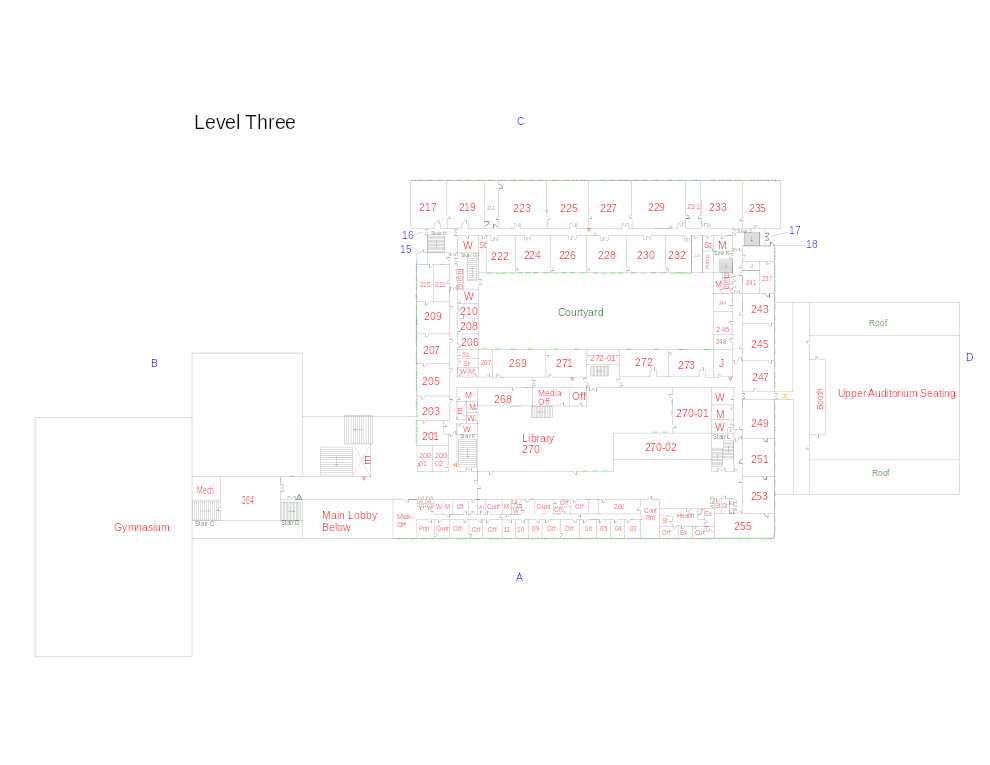
First the PNG of the floor plan is loaded into OpenCV. Then a series of image processing and computer vision techniques are employed to detect the shape of the room, as follows:
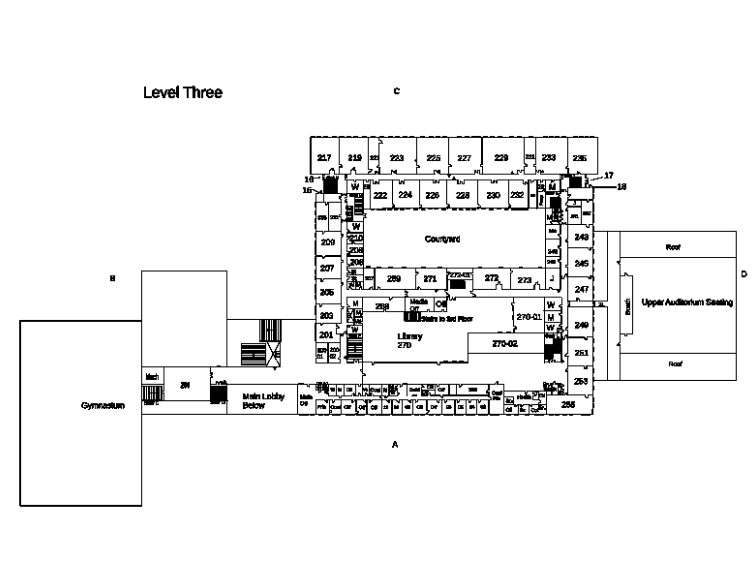
First, the image is binarized. This means that it is converted from standard 3-channel RGB color codes, with 3 values between 0 and 255 defining a color, into an image with 1-channel color codes, dictated by a single value between 0 and 255. This results in what is more commonly known as a “gray-scale” effect, as 0 represents black, 255 represents white, and everything else determining a certain shade of intermediate gray. Binarization makes the detection of objects (in our case, rectangles) much easier in the future.
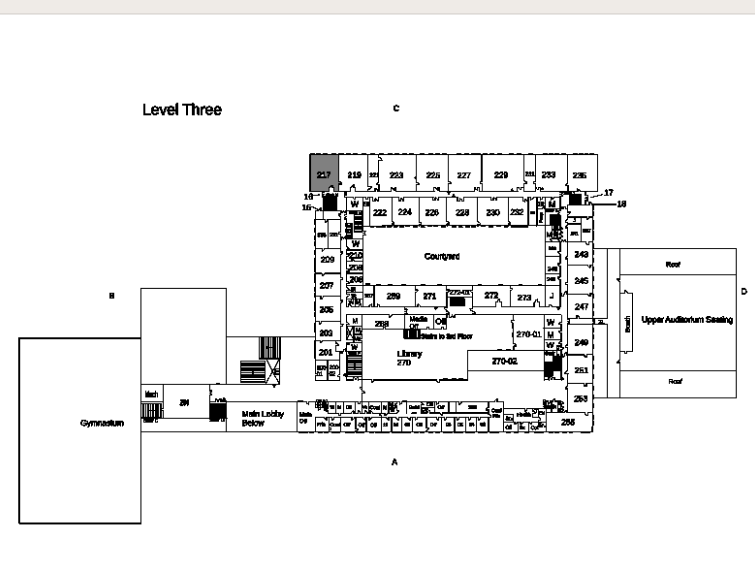
Next, the coordinates of the room’s label’s text box, filtered out from the dataframe obtained by the PDF extraction process shown in part 2, are used. As it is known that the room labels, however they are placed, will be within the room, we can begin a flood fill algorithm (think of the paint bucket feature from MS Paint) from one pixel outside the border of the textbox. This will now be guaranteed to result in the room surrounding the text being filled with a neutral gray, exactly between white and black to minimize its chances of being grouped in with the black and white pixels around it when the image is processed further.
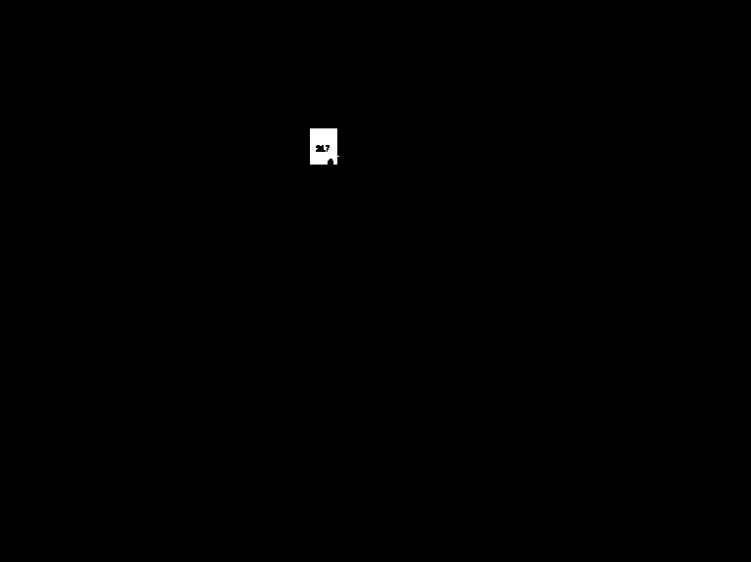
The flood filled image is now binarized again, converting the intermediate gray that filled the room with to white and all other colors to black (a 0-tolerance binarization). As you can see, this has isolated the shape of the room surrounding the text box and has made it much easier to spot the room in the image. However, the shape of the room number’s text still remains and posed a problem to future steps.
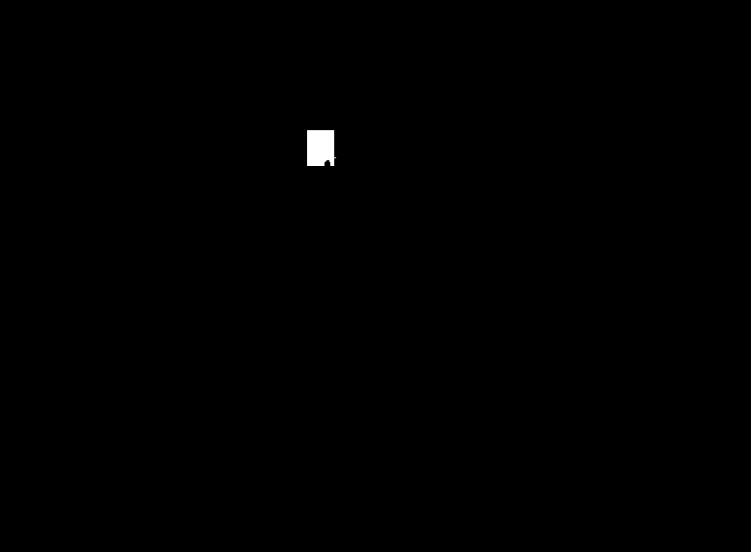
Thus, using the coordinates, width, and height of the text box that were extracted from the PDF, a white rectangle is drawn over the former location of the text box using OpenCV. As you can see, this process fills in the hole and does so consistently without impacting the rest of the shape.
Now, the shape of the room has been isolated very well. It is now possible to quickly detect the outline of the shape, known as the “contour” in OpenCV:
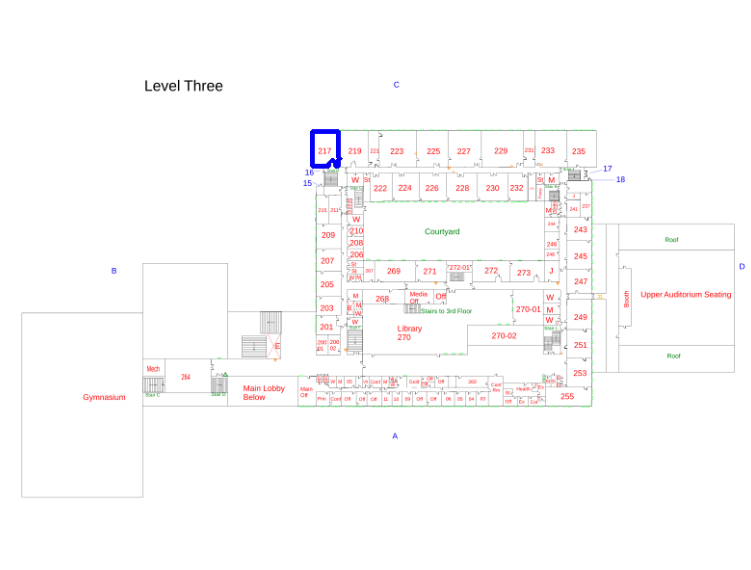
Here, I have displayed the contour (blue) that my OpenCV-based computer vision code detected over the original floor plan.
Although I could have used the countours generated by this process to describe the shape of my rooms on the heatmap, I decided to opt for a consistent, rectangular style that matches the style of the rooms in the building and the floor plan. Thus, the bounding rectangle of the countour is calculated.
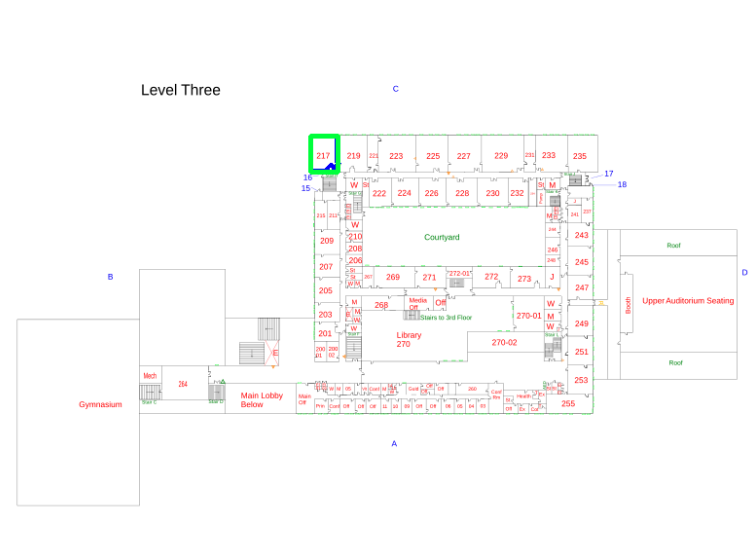
Here, the bounding rectangle (green) of the contour (still blue) is shown.
This bounding box is returned by the function that performs all of this analysis as the detected shape of the room.
The Code
Here is the code that performs the OpenCV component of the process described (located in openCV_tools.py):
def get_room_max_contour(room_text_coords):
    bottom_left = (room_text_coords[0], room_text_coords[1])
    top_right = (room_text_coords[2], room_text_coords[3])

    background_color = (255, 255, 255)  # Runs much, much, much faster if we don't try to detect the dominant colors
    lower_bound = np.array(np.clip([value - 5 for value in background_color], 0, 255))
    upper_bound = np.array(np.clip([value + 5 for value in background_color], 0, 255))
    binary = cv2.inRange(img, lower_bound, upper_bound)

    # cv2.imshow('binary 1', binary)
    # cv2.waitKey(0)
    # cv2.destroyAllWindows()

    replacement_color = 128

    cv2.floodFill(binary, None, bottom_left, replacement_color)
    binary = cv2.inRange(binary, replacement_color, replacement_color)

    # cv2.imshow('binary 2', binary)
    # cv2.waitKey(0)
    # cv2.destroyAllWindows()

    cv2.rectangle(binary, bottom_left, top_right, 255, -1)  # Fill in the room-number-shaped hole for shape recognition

    # cv2.imshow('binary 3', binary)
    # cv2.waitKey(0)
    # cv2.destroyAllWindows()

    ret, thresh = cv2.threshold(binary, 127, 255, 0)
    contours, hierarchy = cv2.findContours(thresh, 1, 2)
    contour = max(contours, key=cv2.contourArea) # grab largest contours

    return contour
Drawing Rooms on the SVG
The svgwrite package, taking advantage of SVG’s “programmablity,” is utilized to add custom SVG rectangles that take the size of the contours’ bounding boxes.
The Code
contour = get_room_contour(room, self.media_box, self.text_and_coords)

if contour is not None:
    path_text = "M"
    for i in range(len(contour)):
        x, y = contour[i][0]
        # Invert y axis (OpenCV measures in the opposite direction)
        y = self.media_box[3] - y
        svg_coords = get_svg_coords((x, y), self.view_box, self.media_box)
        path_text += '{0} {1} '.format(svg_coords[0], svg_coords[1])

    dwg = svgwrite.Drawing(temp_path)
    dwg.add(dwg.path(d=path_text, fill=color_hex_code, opacity=opacity, id="room-rect-{0}".format(room), onmouseover="showRoomData(this, {0}, '{1}')".format(value, units), onmouseout="hideRoomData(this)"))
Notice that I add custom onmouseover and onmouseout properties to the SVG rectangle. This was my sneaky way of simplifying the creation of the interactivity behind the heatmap (when you hover over a room, a popup appears with the room number and an exact reading of its temperature or CO2 level). showRoomData() and hideRoomData() are JavaScript functions that manage this functionality, and onmouseover and onmouseout make detecting when a certain room is hovered over far easier.
The Completed fill_room Function
The complete code for the fill_room() function is shown below. Notice that it includes code to manage duplicating, saving, and merging the generated SVG rectangles (each saved into its own file) into a _filled_rooms_temperature.svg or _filled_rooms_co2.svg file, which are the files displayed by the web interface.
def fill_room(self, room, color_hex_code, opacity, value, units, is_temperature):
    temp_path = self.svg_path[0:-4] + '_temp_rect.svg'
    output_path = self.svg_path[0:-4] + '_filled_rooms_{0}.svg'.format('temperature' if is_temperature else 'co2')

    if not os.path.exists(output_path):
        shutil.copy(self.svg_path, output_path)

    contour = get_room_contour(room, self.media_box, self.text_and_coords)

    if contour is not None:
        path_text = "M"
        for i in range(len(contour)):
            x, y = contour[i][0]
            # Invert y axis (OpenCV measures in the opposite direction)
            y = self.media_box[3] - y
            svg_coords = get_svg_coords((x, y), self.view_box, self.media_box)
            path_text += '{0} {1} '.format(svg_coords[0], svg_coords[1])

        dwg = svgwrite.Drawing(temp_path)
        dwg.add(dwg.path(d=path_text, fill=color_hex_code, opacity=opacity, id="room-rect-{0}".format(room), onmouseover="showRoomData(this, {0}, '{1}')".format(value, units), onmouseout="hideRoomData(this)"))

        dwg.save()  # Save the path to a temporary file

        # Merge the files
        floor_plan = st.fromfile(output_path)
        second_svg = st.fromfile(temp_path)
        floor_plan.append(second_svg)
        floor_plan.save(output_path)
        os.remove(temp_path)
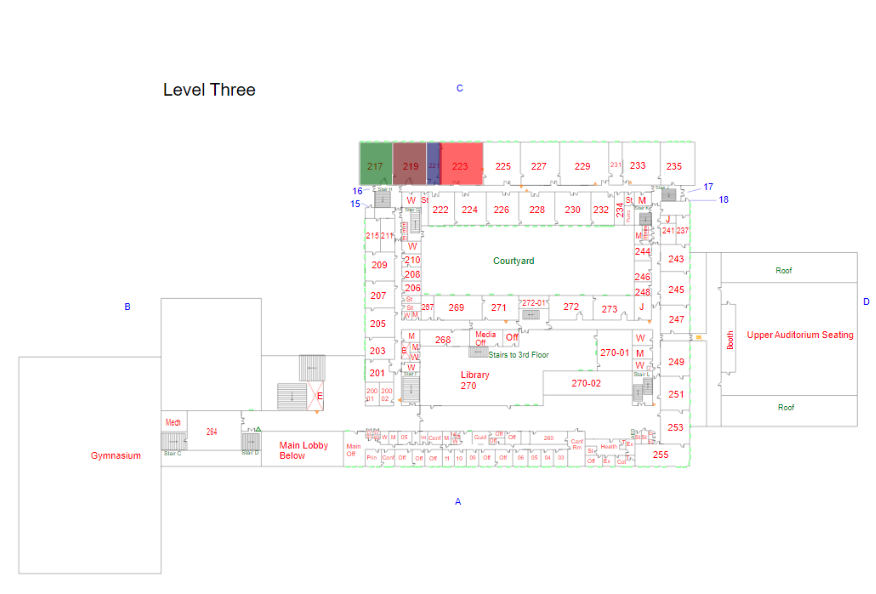
Thus, I could now programmatically fill in the room number of my choice with the color of my choice. The output of calling fill_room() 4 times with dummy colors of my choosing is shown below:
Putting it All Together
By connecting the completed fill_room() function with live sensor data and code that determines the proper color for a room based off of its temperature or CO2 concentration, the heatmaps seen in the final product are generated.
The driver code for filling an entire floor’s heatmap:
def fill_from_data(self, data, is_temperature_value):
    value = data['temperature'] if is_temperature_value else data['co2']
    units = data['temperature units'] if is_temperature_value else data['co2 units']

    if not math.isnan(value) and units is not None and units != '':
        color = self.get_value_color(value, is_temperature_value)
        self.fill_room(data['room'], color, FILLED_PATH_OPACITY, value, units, is_temperature_value)
Ending Notes
Thank you very much for reading this series! This specific aspect of the AHS Heatmap took me the most time to design and develop and involved a great deal of learning on my part. I hope that this explanation may serve others well and save them time in the future. Best of luck with your OpenCV adventures, and Happy New Year!